| Date | Topic | Graphic | Public Source
|
|---|
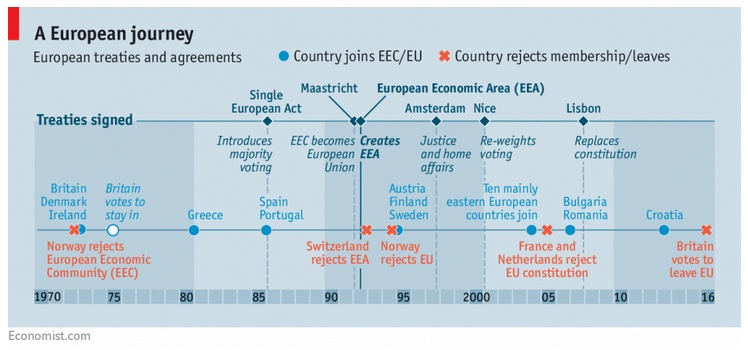
| Feb 24, 2018
| A European Journey (EU Timeline) | Graphic
| Economist
|
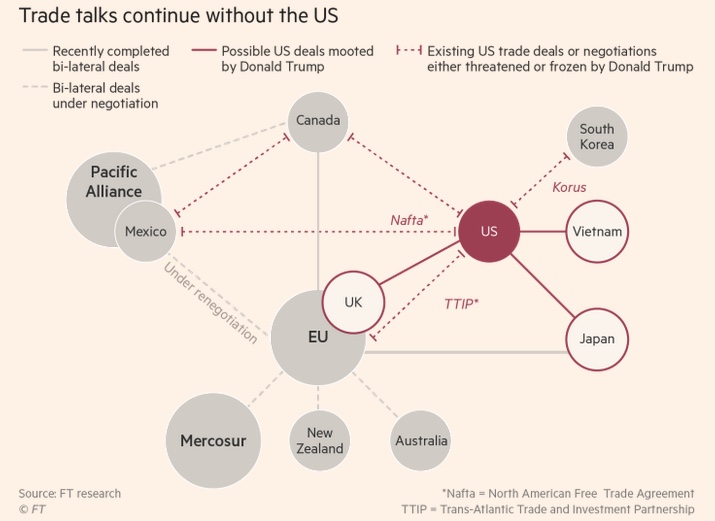
| Nov 6, 2017
| Trade talks continue without the US | Graphic
| FT
|
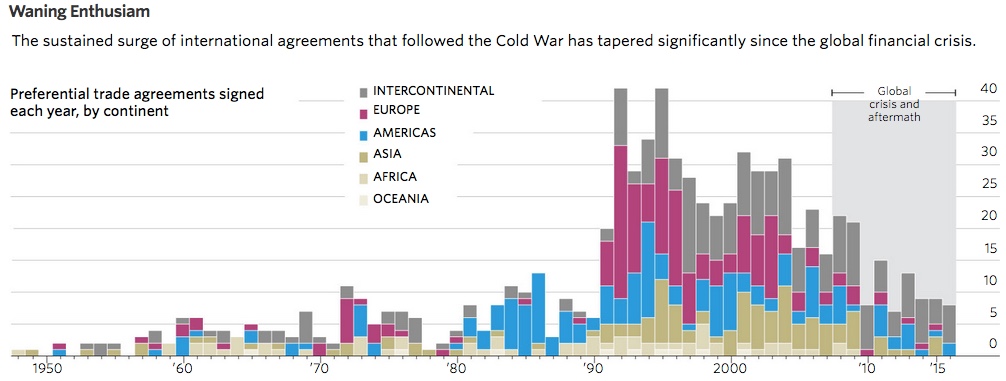
| Mar 30, 2017
| Waning Enthusiasm | Graphic
| WSJ
|
| Mar 30, 2017
| Falling Behind | Graphic
| WSJ
|
| Mar 25, 2017
| Which Europe? | Graphic
| Economist
|
| Mar 14, 2017
| Exports to China and US | Graphic
| WSJ
|
| Mar 7, 2017
| Average tariffs | Graphic
| NYT
|
| Jul 9, 2014
| Asia international reserves | Graphic
| WSJ
|
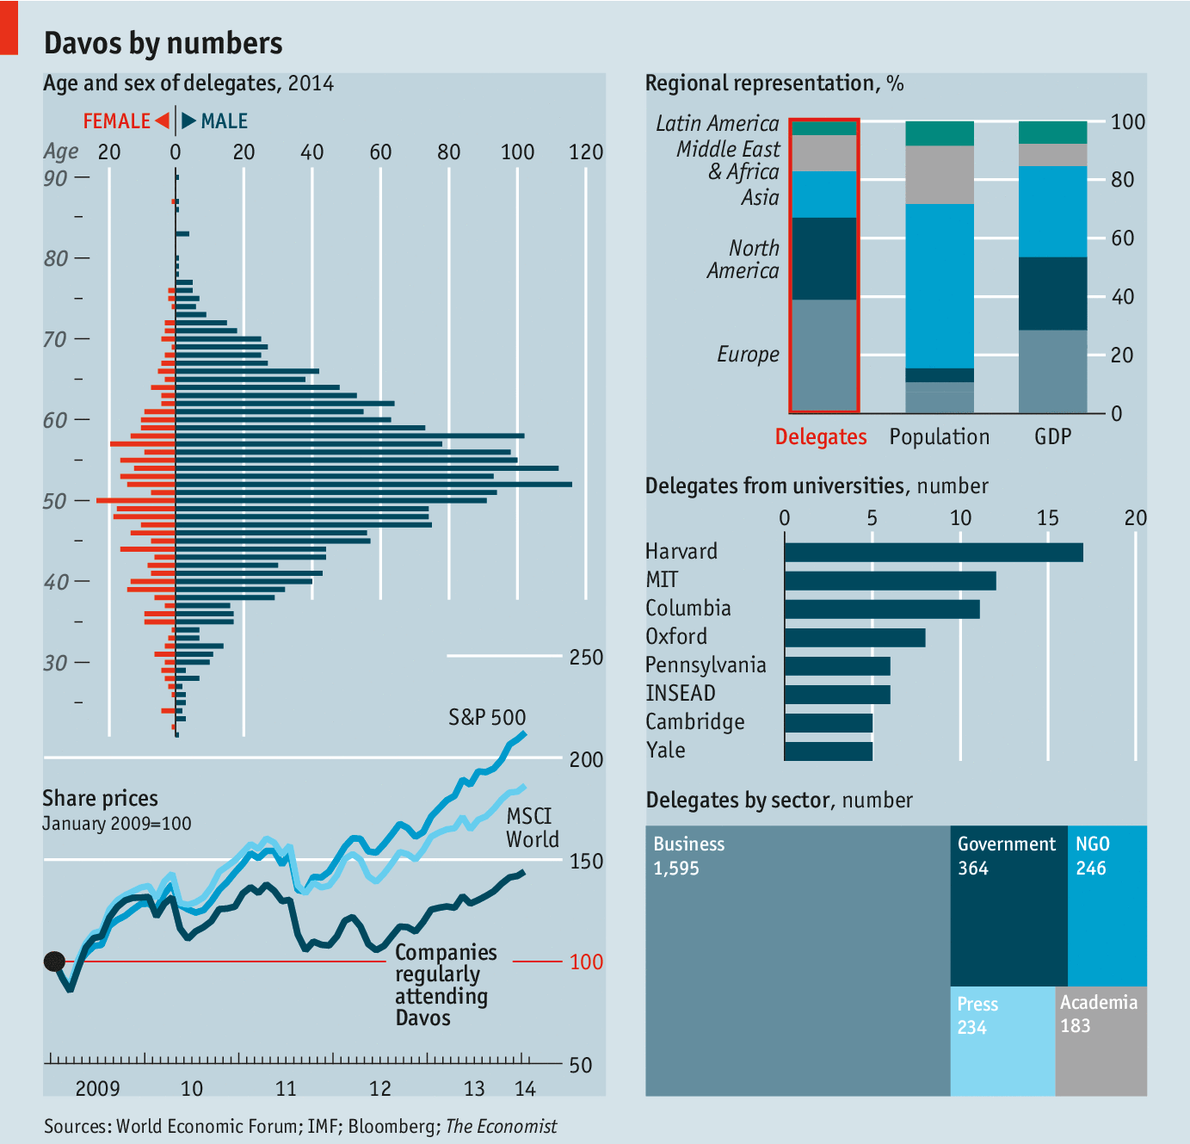
| Jan 25, 2014arif
| Davos by the numbers | Graphic
| Economist
|
| Nov 7, 2013
| Ruble symbol candidates | Graphic
| WSJ
|
| Feb 16, 2013
| China vs US total trade | Graphic
| Economist
|
| Feb 16, 2013
| US & World Trade, 2012 | Graphic
| NYT
|
| Oct 20, 2012
| EU-EEA-EFTA Map | Graphic
| Economist
|
| Oct 20, 2012
| Size of Africa | Graphic
| Economist
|
| Sep 24, 2012
| Migrant Remittances | Graphic
| WSJ
|
| Sep 20, 2012
| The Big Easing (Global Monetary Expansion) | Interactive Graphic
| WSJ
|
| Apr 5, 2012
| Official aid in 2011 | Graphic
| FT
|
| Mar 24, 2012
| Trade-weighted exchange rates | Graphic
| Economist
|
| Feb 25, 2012
| History of Financial Innovation | Graphic
| Economist
|
| Feb 18, 2012
| Trade 2009-11 | Graphic
| WSJ
|
| Feb 8, 2012
| Yankee dollar | Graphic
| WSJ
|
| Feb 7, 2012
| TPP Map | Map
| WSJ
|
| Jan 28, 2012
| Global FDI | Graph
| Economist
|
| Dec 31, 2011
| Value added in iPad | Graph
| Economist
|
| Dec 31, 2011
| Schengen Area Map | Map
| Economist
|
| Dec 30, 2011
| Euro 2010-11 | Graph
| WSJ
|
| Nov 25, 2011
| Two Diasporas | Graph
| Economist
|
| Nov 12, 2011
| Projected working population | Graph
| WSJ
|
| Oct 20, 2011
| China's trade balance | Graph
| WSJ
|
| Oct 9, 2011
| US foreign aid | Graph
| NYT
|
| Oct 7, 2011
| US Manufacturing & China trade balance
| Graph
| FT
|
| Aug 13, 2011
| Yen-dollar rate 40 years
| Graph
| Economist
|
| Aug 12, 2011
| China currency
| Graph
| FT
|
| Aug 6, 2011
| Emerging economies share of world | Graph
| Economist
|
| July 27, 2011
| FDI inflows
| Graph
| WSJ
|
| July 19, 2011
| Holders of US Govt Debt
| Graph
| NYT
|
| July 15, 2011
| China exchange rate and reserves
| Graph
| WSJ
|
| June 6, 2011
| An Imperfect Union (Eurozone)
| Graph
| WSJ
|
| June 3, 2011
| Global natural gas prices
| Graph
| FT
|
| May 12, 2011
| World Population
| Graph
| WSJ
|
| May 5, 2011
| US Dollar 1980-2011
| Graph
| WSJ
|
| Apr 28, 2011
| World Trade 2001-10
| Graph
| WSJ
|
| Apr 16, 2011
| Trade recovery 2008-11
| Graph
| FT
|
| Apr 14, 2011
| Trade balances, goods & services, 2010
| Graph
| Economist
|
| Apr 7, 2011
| Dollar/euro 2010-11
| Graph
| FT
|
| Mar 11, 2011
| Currency volatility
| Graph
| FT
|
| Feb 12, 2011
| US exports
| Graph
| NYT
|
| Feb 9, 2011
| Reserves, US deficit, gold and silver
| Graph
| FT
|
| Jan 29, 2011
| Global imbalances
| Graph
| Economist
|
| Jan 22, 2011
| China exchange rate and inflation
| Graph
| NYT
|
| Jan 12, 2011
| China money & reserves
| Graph
| NYT
|
| Dec 11, 2010
| US trade
| Graph
| WSJ
|
| Nov 13, 2010
| Trade imbalances 2000-10
| Graph
| NYT
|
| Nov 12, 2010
| Global imbalances
| Graph
| FT
|
| Nov 10, 2010
| China exchange rate and trade balance
| Graph
| FT
|
| Oct 26, 2010
| Renminbi Jun-Oct 2010
| Graph
| FT
|
| Sep 8, 2010
| China Trade Surplus
| Graph
| WSJ
|
| Sep 1, 2010
| US Agriculture Exports
| Graph
| NYT
|
| August 21, 2010
| Who Lends to the US?
| Graph
| NYT
|
| August 16, 2010
| Russian grain exports
| Graph
| WSJ
|
| July 14, 2010
| U.S. Trade, 2008-10
| Graph
| WSJ
|
| May 19, 2010
| Change in price of items since 1978
| Graph
| NYT
|
| May 19, 2010
| Renminbi against the euro
| Graph
| FT
|
| May 19, 2010
| Euro performance
| Graph
| FT
|
| May 18, 2010
| Eurozone exports
| Graph
| FT
|
| May 15, 2010
| Trends in Exports and Imports
| Graph
| NYT
|
| May 1, 2010
| Europe's web of debt
| Graph
| NYT
|
| Apr 21, 2010
| Emerging market real exchange rates
| Graph
| FT
|
| Apr 15, 2010
| BRICs in Groups
| Graphic
| Economist
|
| Apr 15, 2010
| Why the BRICs Matter
| Graph
| Economist
|
| Feb 20, 2010
| US and World Sugar Prices
| Graph
| WSJ
|
| Feb 20, 2010
| Net official development assistance as % of GDP
| Graph
| Economist
|
| Feb 19, 2010
| World per capita consumption of meat, eggs, milk since 1961
| Graph
| FT
|
| Feb 17, 2010
| Foreign holders of US securities
| Graph
| FT
|
| Feb 11, 2010
| US trade deficit December 2009
| Graph
| NYT
|
| Feb 6, 2010
| China exports
| Graph
| WSJ
|
| Jan 30, 2010
| World trade 2008-09
| Graph
| Economist
|
.jpg)