March Madness!
I strongly believe that statistical modeling can be used to predict success in the NCAA Division I Men's Basketball Tournament. I'm interested in the development of regression models that can be used to predict success, and in two JQAS papers, I present a simple and flexible rating method for predicting success in the NCAA basketball tournament. The paper utilizes a method based on ordinal logistic regression and expectation (OLRE) for prediction. I long believed that the RPI was a numerically flawed rating system that received an unfair amount of weight in selecting and seeding teams for the tournament, and I have shown that my models consistently out-performed the RPI in terms of predicting success in the tournament. The RPI was finally eliminated prior to the 2018-2019 season, and replaced by the NET ratings.
If numerical ratings like the NET are going to be considered in seeding teams selected for the tournament, the selection committee should focus on the ratings that do the best job of actually predicting success in the tournament, or pre-tournament ratings that correlate very well with actual success. The "best" ratings can be used to identify teams that are likely to do well in the tournament (and thus teams that are most eligible to compete for the national championship). I collect data on NET ratings, BPI ratings, Ken Pomeroy's ratings, and the predictors of success that I consider in my models, and then calculate predicted success in the tournament (which can be translated into a rating) based on my models. You can view the final 2026 data and results, in addition to results from previous years, here.
IMPORTANT NOTE: In 2024, a crucial input to the ratings ceased to exist (the Sagarin SOS metric), as Jeff Sagarin stopped computing his ratings after faithfully computing them for so many years. As a result, the model will need "re-training" using new inputs. I explored the correlations of new team-level metrics with team success starting in 2024, and I have started to retrain the model based on these new metrics in 2025.
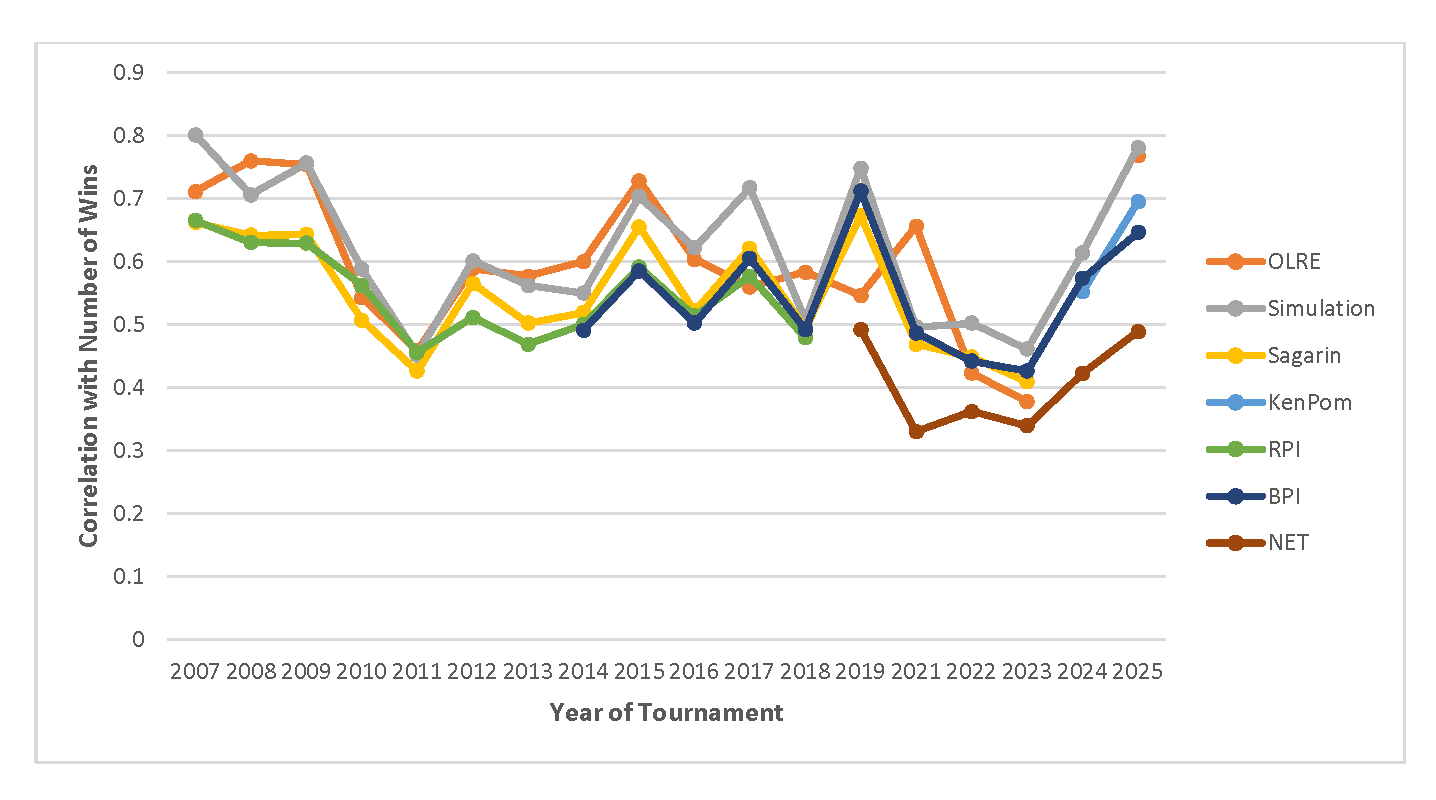
In the 2026 tournament, my predictions based on the OLRE methodology and the Bradley-Terry simulation method had correlations with actual success in the tournament (0.782 and 0.765, respectively) that were higher than the pre-tournament KenPom ratings (0.679), the BPI ratings (0.663), and the NET ratings (0.510). The plot below shows yearly trends in the correlations of the various ratings with the actual counts of wins in the NCAA tournament. Feedback and comments are more than welcome!
 Last modified 4/7/26 by Brady T. West