| |
|
EXAMPLE CD7-5
Match Eadie Plots to the Different Types of Inhibition
| |
|
|
|
Determine the figure that corresponds to each of the three types of inhibition:
competitive, uncompetitive, and noncompetitive. |
|
|
|
|
|
|
|
|
|
SOLUTION |
|
|
|
|
For competitive inhibition: |
|
|
|
|
|
|
|
|
|

|
|
|
|
|
|
|
|
|
|
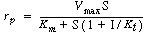
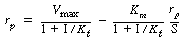
Multiplying by and rearranging ,
we obtain ,
we obtain |
|
|
|
|
|
|
|
|
|
|
|
|
|
|
|
|
|
|
|
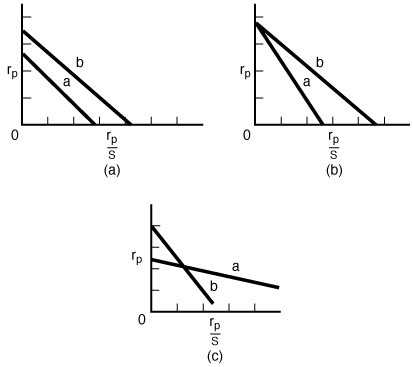
We see that a plot of rp
vs. rp /S will be a straight
line with a slope ,
where ,
where |
|
|
|
|
|
|
|
|
|
|
|
|
|
|
|
|
|
|
|
A change in the inhibitor concentration will
change the slope of the Eadie plot but not the intercept. The greater the
inhibitor concentration, the greater (i.e., steeper) the slope. |
|
|
|
|
|
|
|
|
|
For uncompetitive inhibition: |
|
|
|
|
|
|
|
|
|
|
|
|
|
|
|
|
|
|
|
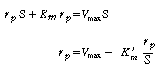
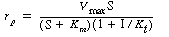
After rearranging (CD7-16) so that |
|
|
|
|
|
|
|
|
|
|
|
|
|
|
|
|
|
|
|
we see that increasing the inhibitor concentration
will decrease the slope and the intercept of an Eadie plot. |
|
|
|
|
|
|
|
|
|
|
|
|
|
|
|
|
|
|
|
For noncompetitive inhibition: |
|
|
|
|
|
|
|
|
|
|
|
|
|
|
|
|
|
|
|
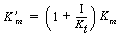
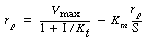
Again,multiplying by (S + K m)
and rearranging, we obtain |
|
|
|
|
|
|
|
|
|
|
|
|
|
|
|
|
|
|
|
In the case of noncompetitive inhibition, increasing
the inhibitor concentration decreases the intercept but does not affect
the slope of an Eadie plot. |
|
|
|
|
|
|
|
|
|
|
|