Chapter 17: Distributions of Residence Times for Chemical Reactors
Example: Calculate Xmm and Xseg
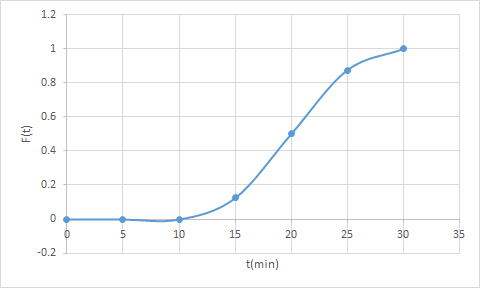
Calculate the conversion in a real reactor using the segregation and the maximum mixedness model. The reaction A -> B is carried out in a real reactor that has the following F-curve. The entering concentration of A is 8 mol/dm3. The following F(t) was determined from a trace test
For 10<t<20
![]()
For 20<t<30
![]()
The reaction rate also varies with time as per below equation
For 10<t<20 -rA = k * CA0.6
For 20<t<30 -rA = k * CA2.7
Where, k=0.1
Calculate the conversion using
1) the segregation model
2) the maximum mixedness model
Also explain the difference in conversions between the two models.
Solution
1) X seg = 0.796 [Polymath code]
2) X mm = 0.796 [Polymath code]
Both models predict the same conversion!
The reason is: for reaction order 0 < n < 1, max mixedness predicts higher conversion and for n > 1, segregation predicts higher “X”. In this
case, the reaction goes from 0.6 to 2.7 as CA decreases. Thus, the predictions of the two models average out.