e) Assuming that the volumetric flow rates entering and leaving the basin are identical v = vo show that the unsteady mole balance on CO within the basin becomes
FCO,A + FCO,S - vOCCO = V(dCCO/dt)
From the general material balance equation:
Input – Output + Generation – Consumption = Accumulation

Therefore, substitution yields:

 Top
Top
f) Verify that the solution to the previous equation is

Starting from the equation obtained in part e, we must first separate variables by solving for dt, which is the value that we are trying to obtain. We might as well assume that FCO,A and FCO,S are a constant factor.


V, the total volume of air in the Basin, is considered to be constant. FCO,A and FCO,S represent a specific volumetric flow rate multiplied by a specific concentration (vxCCO,x), which is also constant.

Only dt and CCO remain as the last variables in the equation. Let CCO = x to simplify mathematical procedures. Let FCO,A+ FCO,S = a to represent a constant term. Let vo = b.

We can know integrate the equation.


Top
g) If the initial concentration of carbon monoxide in the Los Angeles basin before the Santa Ana wind starts to blow is 8 ppm (2.04 x 10⁻⁸ lb mol/ft3), calculate the time required for the carbon monoxide to reach a level of 2 ppm.
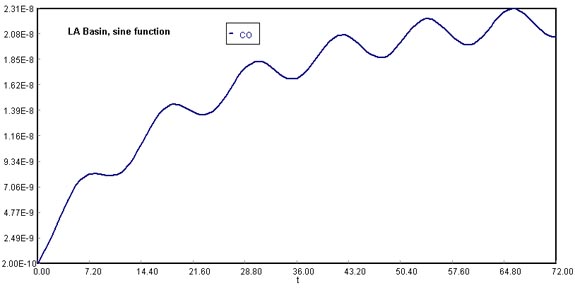
h) There is heavier traffic in the L.A. basin in the mornings and in the evenings as workers go to and from work in downtown L.A. Consequently, the flow of CO into the L.A. basin might be better represented by the sine function over a 24-hour period.
FCO,A = a + b sin(π *t/6)
The time, t = 0, starts at midnight. Where a = 35,000 lb mol/h and b = 30,000 lb mol/h. The general material balance equation now becomes
a + b sin(π*t/6) + FCO,S - vOCCO = V(dCCO/dt)
(Sine function, original conditions)
Load Living Example Problem
Download the original Polymath file of this problem, by clicking here:
LA Basin, sine function
Top
Use Polymath
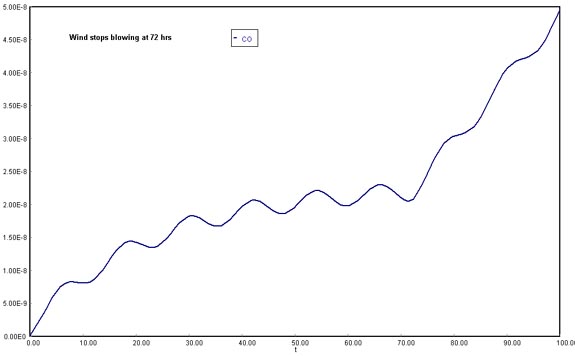
1) Smog begins to build up again immediately after a Santa Ana wind passes through the basin. The volumetric flow rate through the basin has dropped to 1.67 x 1012 ft3/hr (1.5 mph). Plot the concentration of carbon monoxide in the basin as a function of time for up to 72 hours and just after a Santa Ana wind. The initial concentration of CO is 0.08 ppm (2 x 10⁻¹⁰ lbmol/ft3).
(Assuming wind stops blowing after 72 h)
Download the original Polymath file of this problem, by clicking here:
LA Basin, 72 h
Considering that the Santa Ana wind provides a means of cleansing and lowering CO concentration in the Los Angeles Basin, once the current stops being available there would be no vehicle to dilute the air contaminants. Therefore, CO molecules would start to accumulate in the fixed volume of the system. This shows in the steep rise of carbon monoxide concentrations after 72 h.
Top
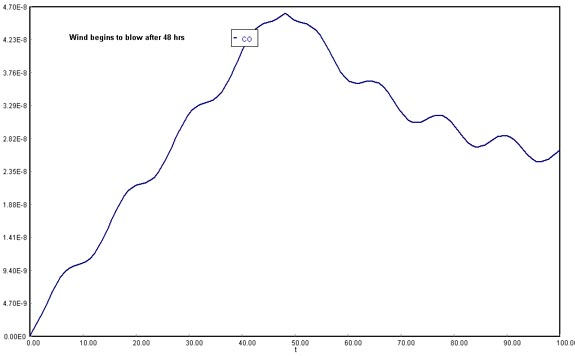
2) Plot the concentration of carbon monoxide as a function of time t up to 48 hours for the case when a Santa Ana wind begins to blow after the 48 hours buildup of CO.
(Assuming wind is not blowing until 48 h, and then resumes at 1.67E+12 ft3/h)
Download the original Polymath file of this problem, by clicking here:
LA Basin, 48 h
The opposite phenomenon occurs once the wind starts blowing: with the possibility of venting out the accumulated gases in the Los Angeles Basin, the CO concentration will decrease abruptly. However, in the long run, it will increase again and stabilize.
Top
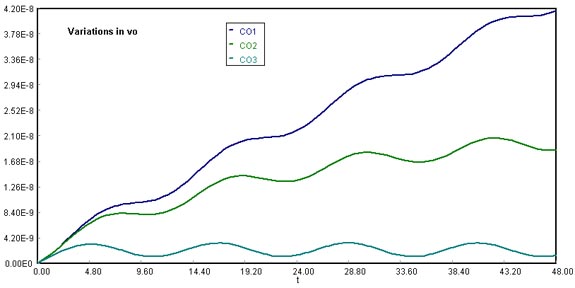
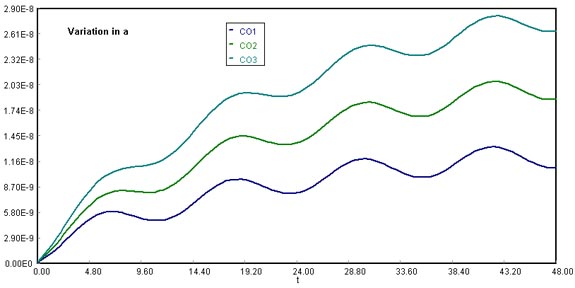
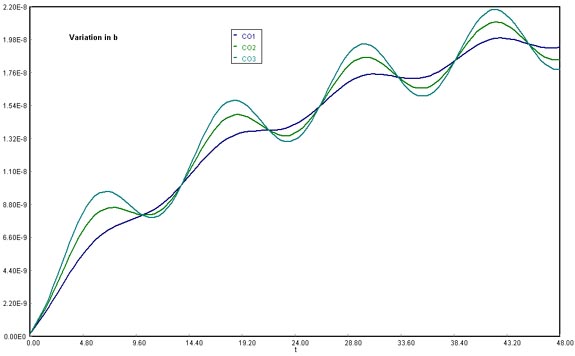
3) Vary the parameters, vo , a, b, and write a paragraph describing what you find.
Download the original Polymath file of this problem, by clicking here:
LA Basin, vo variations
Using vo at 1.67E+11 ft3/h, 1.67E+12 ft3/h, and 1.67E+13 ft3/h, we found an inversely proportional relationship between CO accumulation and volumetric flow rate of the Santa Ana wind. Thus, when vo is the lowest, CO accumulation presents a steeper slope than the other runs. It is important to note that at vo = 1.67E+13 ft3/h, a stabilizing condition occurs, meaning that the amount of CO released by vehicles becomes negligible.
Download the original Polymath file of this problem, by clicking here:
LA Basin, a variations
Using a at 20000 lbmol CO/h, 35000 lbmol CO/h, and 50000 lbmol CO/h, we notice that the final CO accumulation varies proportionally with the magnitude chosen. This happens because as the sine function for CO emissions in cars spreads over time, the accumulation tends to equal the y-axis intercept (a) of the sine function.
Download the original Polymath file of this problem, by clicking here:
LA Basin, b variations
Using b at 15000 lbmol CO/h, 35000 lbmol CO/h, and 50000 lbmol CO/h, the amplitude of the variation in CO accumulation increased directly as the values for b became higher. This would be explained mathematically by remembering that the b multiplies the sine function directly, meaning that it accounts for its degree of amplitude from reference to lowest/highest crest.
Top


