|
Are
diamonds really forever?
An
experiment to determine the ultimate stability of matter
|
|
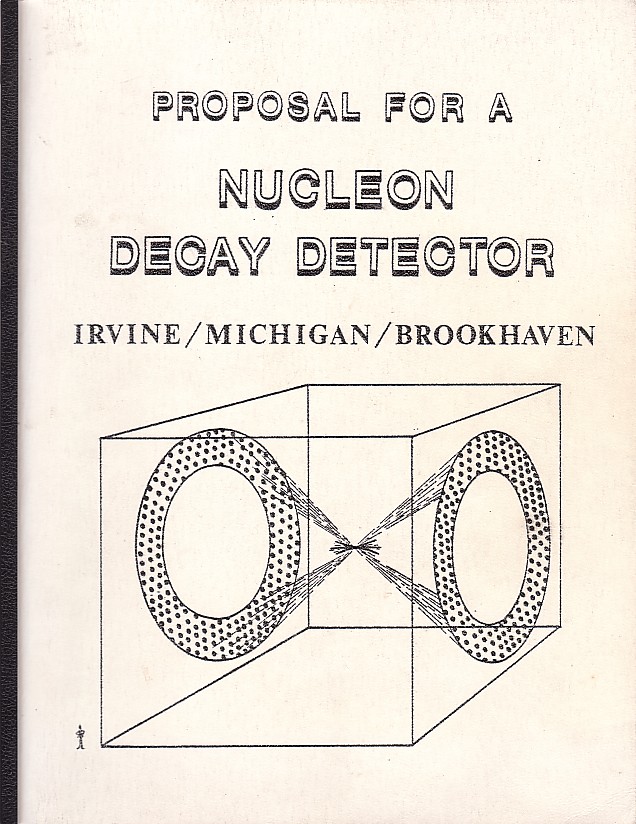
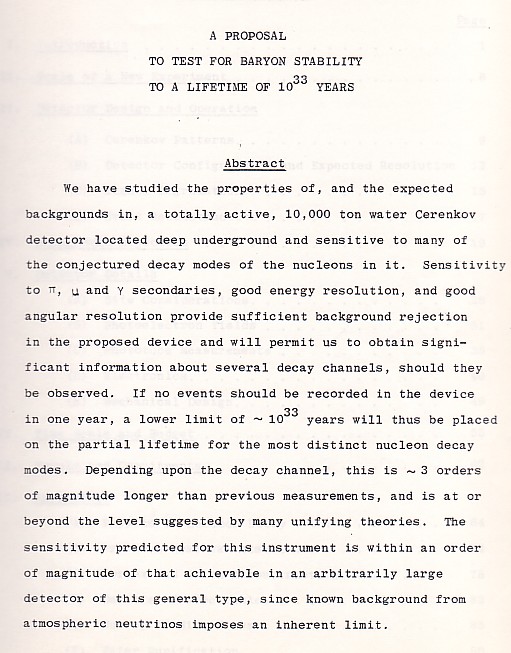
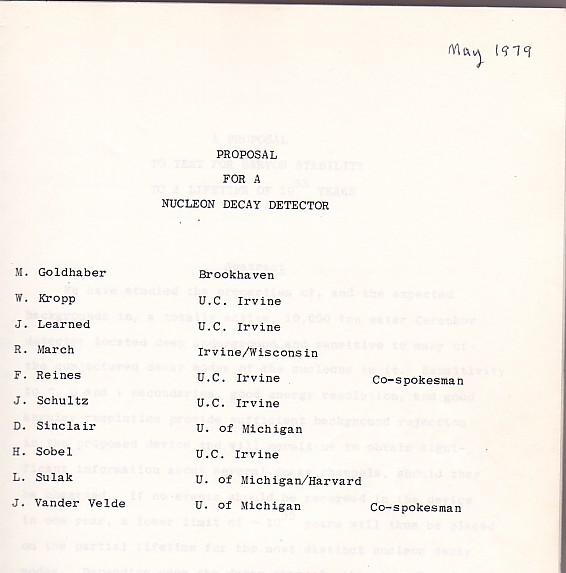
Proposal sent to the Department
of Energy in May, 1979
|
|
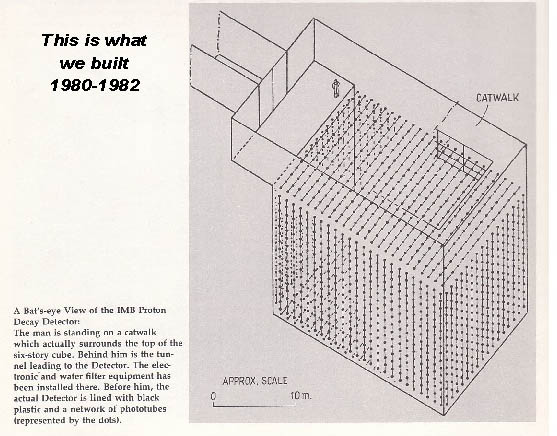
The detector "pool"
was filled with 2.5 million gallons of ultra-pure water
The six sides were covered with 2048 photomultiplier tubes
Figures above are from the University
of Michigan Research News (July, 1981)
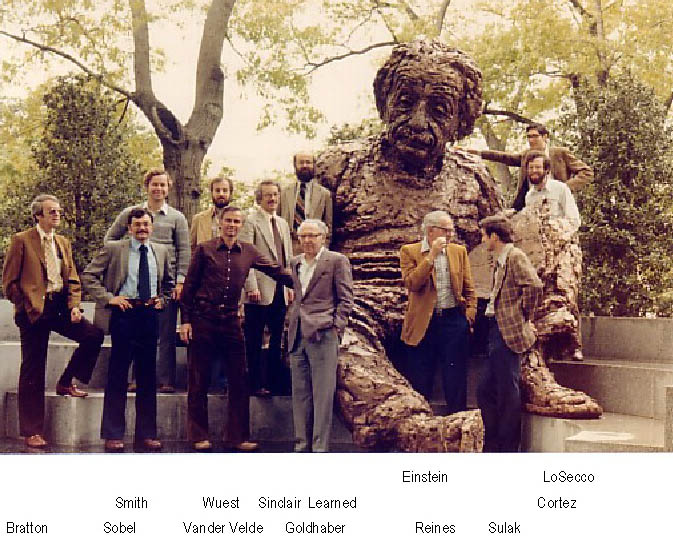
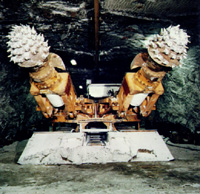
Most
of the original IMB group in WASHINGTON D.C. (April,1980)
|
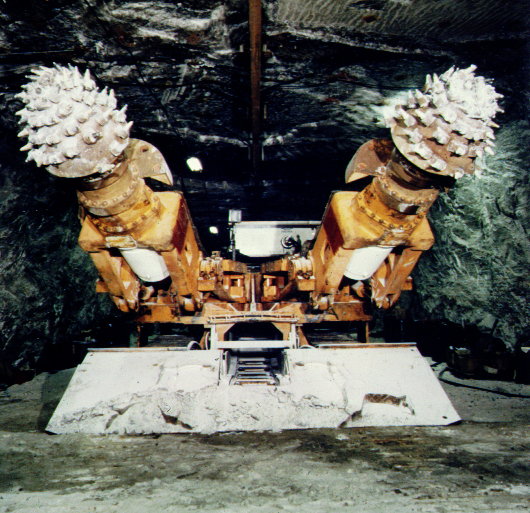
Pictures below show the construction
in the
Morton salt mine in Mentor, Ohio
1979-1981
Funding was provided by
the University of Michigan,
the University of California at Irvine,
and the U.S. Department of Energy
(These pictures can be clicked to enlarge)
Dosco machine that
dug the cavity
1979-1980
|

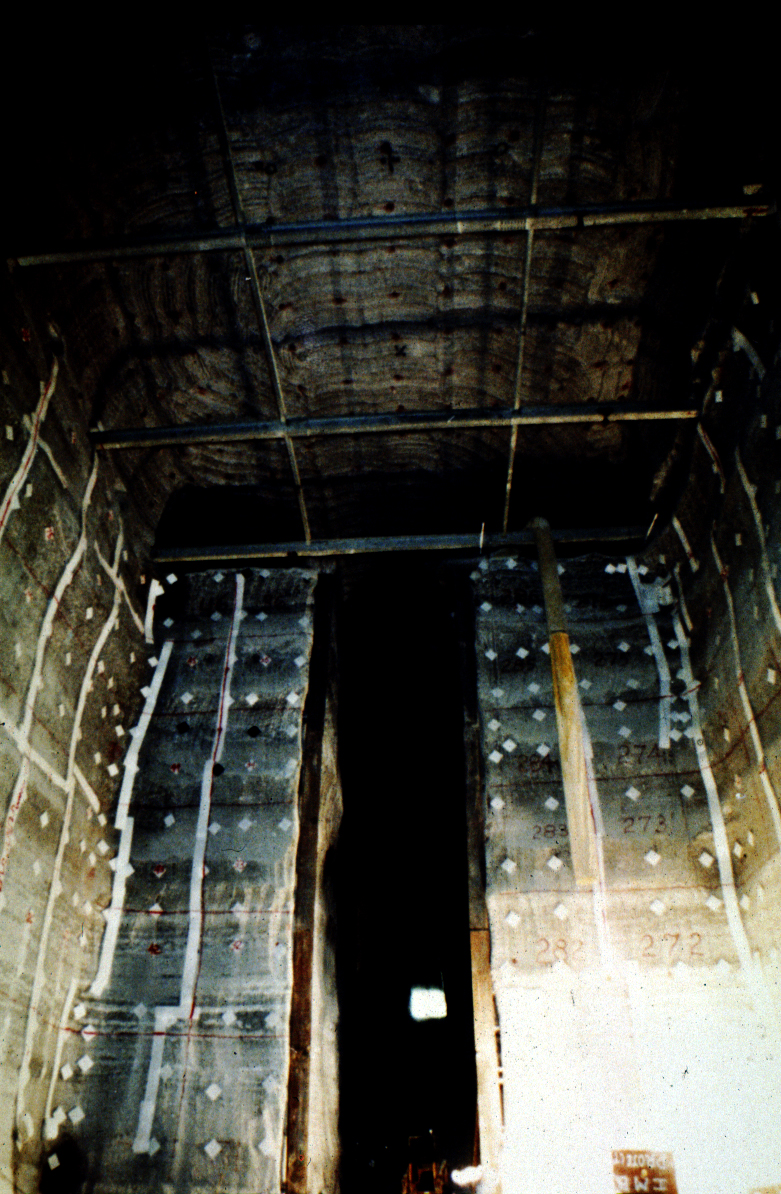
From bottom of finished cavity
looking out of tunnel to mine
|
|
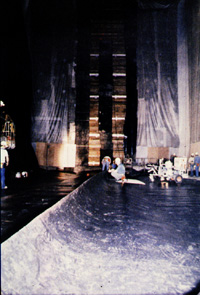
Installing double layered
"Schlegel" liner
|
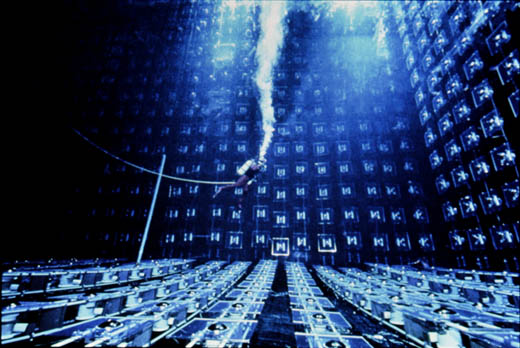
Scuba diver in finished tank ("pool")
|
|
More and better
pictures at (UMDL)
Back
to Top
FILLING
THE POOL
In October, 1981 the double-walled
liner was in place and we started filling the pool with ultra-pure
water. At a depth of 11 feet the expected signals from cosmic ray
muons looked good. However some small leaks developed and the water
was emptied in order to make repairs on the liner.
In January of 1982 we started to refill,
but at a depth of 13 feet a new large leak developed. We needed
to rethink the problem of how to contain this much water. A scheme
was devised to support the liner by pouring low-density concrete
on the outside at the same rate the water was introduced on the
inside. This was a slow process but it worked well and the full
70 foot depth was reached in July, 1982.
At that point all of the electronics
and the data acquisition computers were in place. We started
to record our first events.
Even though the detector was 1900 feet
underground, cosmic ray muons went through at a rate of three per
second. Since our design goal was to identify as few as one proton
decay per year we needed to find one needle in a haystack of
100 million muons.
The
pictures below show how this was possible.
|
|
|
|
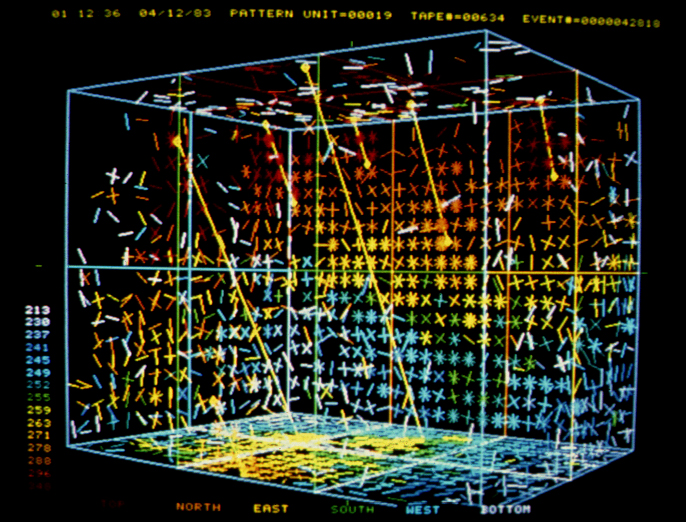
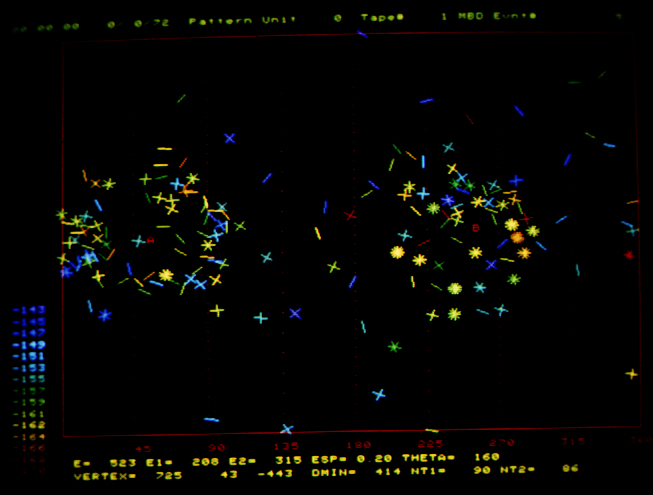
This computer image shows seven cosmic ray
muons (yellow lines) going through the detector simultaneously.Charged
particles like these emit a cone of Cherenkov light which travels
through the water and hits the photomultiplier tubes (PMT's) covering
the six walls of the detector. Each slash represents one Cherenkov
photon hitting a PMT. The colors indicate the time the PMT was
hit. The color scale at left gives the time in nanoseconds (ns).
The scale is negative, starting around -300 ns and ending around
-220 ns. A typical cosmic ray takes about (300-220)=80 ns to traverse
the 80 ft detector at a speed of about one foot per ns (essentially
the speed of light).
The paths of the muons are reconstructed from
the PMT data to within an accuracy of a few degrees.
|
|

|
The above 7-muon event is rare..... muons usually
go through one or two at a time.
The event at left is even rarer, occurring only
about once a week. It is a muon going through upwards from the
BOTTOM (indicated by purple rectangles) and exiting at the TOP
(red rectangles).
This muon was not generated in the atmosphere
above (like the down-going ones) but in the earth itself below
the detector. A high energy neutrino generated in the atmosphere
on the other side of the world passed all the way through the
earth and happened to interact just below the detector to produce
the up-going muon.
|
| |
This event is also an upward-going muon that enters
the BOTTOM near the NORTH wall (back wall in this view). The muon
doesn't go all the way through the detector but skims along the
NORTH wall and stops in the water about 2/3 the way through.
This muon generates a Cherenkov cone that can be
seen developing in time by mousing-over
(not clicking) on the buttons.
The yellow squares in picture 5 show where the outside
of the Cherenkov cone intersects the NORTH, TOP, and EAST walls.
The pictures are about 20 ns apart in time.
|
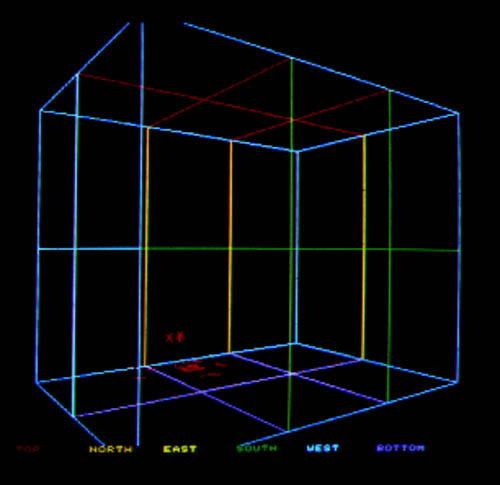
NOW.... HOW TO DETECT DECAYING
PROTONS:
The pictures below illustrate four different
ways to view the same event,
an upward-going muon which starts inside the detector and goes
about 7 ft
before slowing down and stopping in the water.
The muon was produced by an upward-going neutrino which interacted
with a nucleon (proton or neutron) in the water.
Such tracks make a single thin Cherenkov cone which lights up a ring
of PMT's.
The cone has a (half) opening angle of 41 deg so
the size of the ring of tubes will depend on how far away from the wall
the track started.

Looking down into the tank we see
a large Cherenkov ring hitting the TOP, SOUTH, WEST, and NORTH
walls. It's difficult to discern a ring in this view.
|

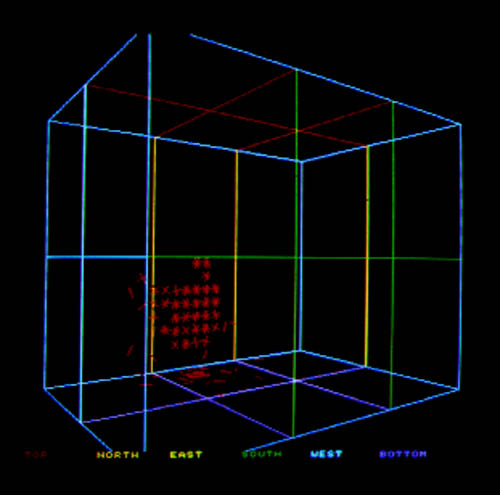
The ring is much easier to see in
this "fisheye" view in which the observer's eye
is put at the origin of the muon track.
|

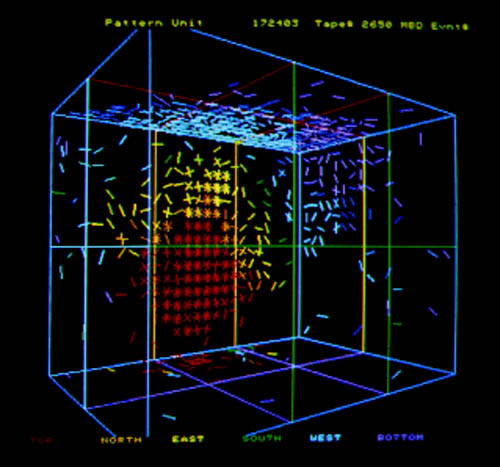
In this view the PMT hits are projected
onto a cylinder whose center is at the "fisheye".
The cylinder is then unrolled to be a plane. The blue and purple
hits are due to photons that scattered in the water before hitting
the walls. Their color indicates they arrived much later than
the green and yellow hits of the
main ring.
|

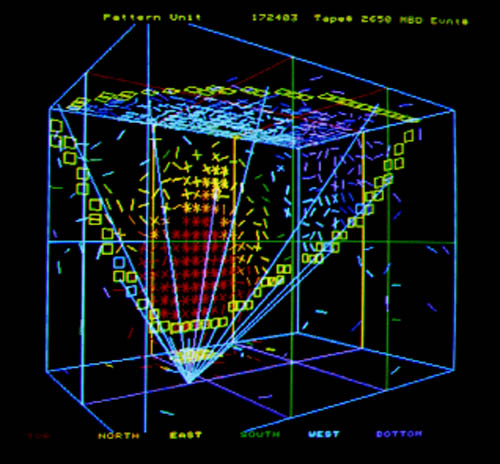
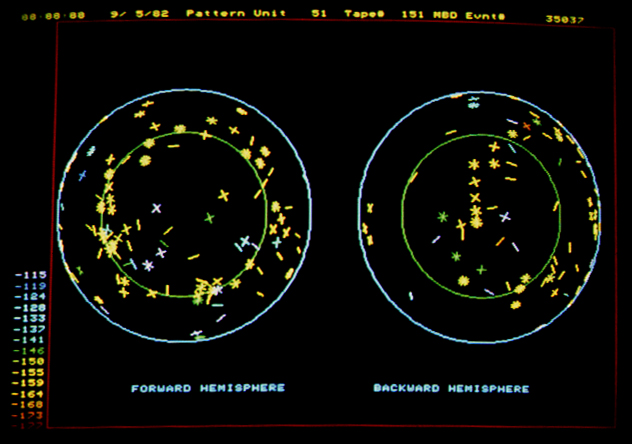
This shows the
hits are projected onto a sphere whose center is at the
fisheye. The sphere is then opened up so the ring is in the "forward"
hemisphere. The green ring is the outer edge of an ideal 41 degree
Cherenkov cone. A perfect track in a perfect world would have all
the hits be the same color and just inside of the green circle.
Note that the "backward"
hemisphere is empty for this single-track event. It represents only
one-half of what would be seen in a true proton decay event.
Protons are essentially at rest in
the water and their decay must result in at least two new particles
going in opposite directions. We use this feature to distinguish
proton decays from neutrino interactions in the water.
This is illustrated below.
|
 |
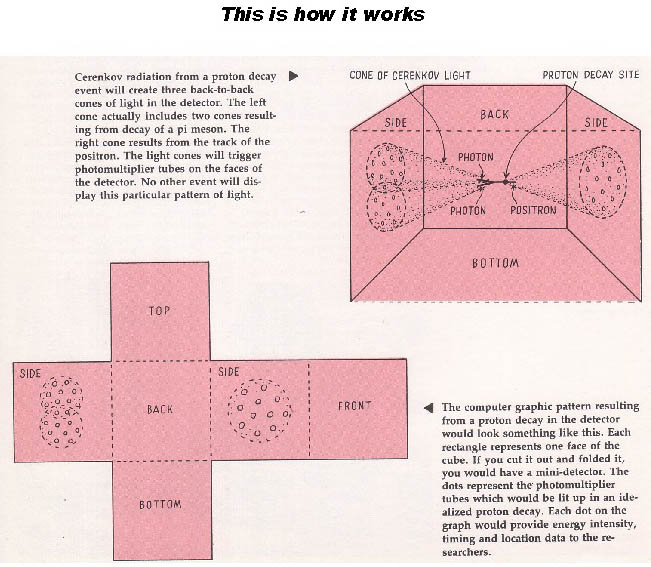
The initial version of the IMB detector was designed
to look for one of the simplest modes:
a proton decaying into a positron (e+) and a neutral pion
(pi0). These particles would give rise to two Cherenkov cones
going in opposite directions.
The event at left is an artificial ("monte
carlo") event which gives an example of what a realproton decay
into e+ and pi0 would look like on the cylinder plot.
The two rings are not very well-defined here because the electromagnetic
showers produced by the e+ and pi0 contain several electrons and
positrons with scattered directions.
The two red A
and B
points are where the computer estimated the centers of the
two showers were pointed. The calculated angle between the shower
directions was 160 deg., which is near the 180 deg. angle at which
they were generated.
A real event which is similar to this one
is seen in the cylinder plot on the left below.
|
The three pictures below are three views
of an event we recorded in our first few months of running
in the fall of 1982. It looks quite similar to the above simulated event,
so naturally we were quite
excited when we first saw it. On closer inspection, however, the event
has three properties
that don't match proton decay. Any one of these is sufficient to
reject it.
These properties are explained below the pictures.
|

This cylinder plot shows one fatal
property of this event:
It has too much total energy.
Qualitatively one can see many more total slashes than on the plot
above it. Quantitatively it's total energy is estimated to be 1230
MeV, too far from the 938 MeV value expected from a proton decay.
|
Secondly, it's clear from this sphere
plot that the two showers are not 180 deg apart. In fact the measured
angle between A and
B on the cylinder plot is only 135 deg: too far
from the expected 180 deg of a proton decay at rest.
|
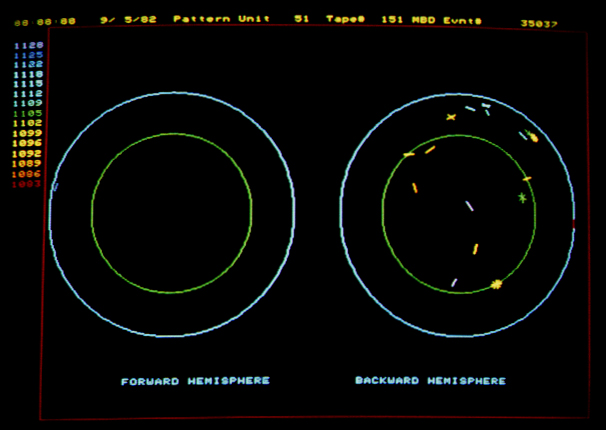
This particular event has a third
fatal flaw:
The IMB detector had a "T2 time
scale", designed to capture the signal from a muon decaying
into an electron a few microseconds after the main event.This would
indicate that one of the tracks in the main event was a muon. A
picture of the T2 time scale above clearly shows a signal of an
electron in the vicinity of the backward-hemisphere track on the
sphere plot, so this event can not be due to an (e+,pi0) decay mode.
It could perhaps be a (mu+,pi0) mode but then the energy and angle
requirements would still rule it out.
|
So
if the above event is not a proton decay, what is it?
|
The above event is one of 69 that
were found inside the IMB detector in its first 80 live days of
operation.
This event rate agreed (within a factor of two) with expectations
due to neutrino interactions in the water.
The neutrinos are produced by cosmic rays hitting the atmosphere
all around the Earth.
Billions of them pass through the detector every second and from
every direction.
About once per day a neutrino will interact in the water producing
some charged particles which leave telltale Cherenkov rings.
Of the first 69 events only three
vaguely resembled the hypothesized proton decay into (e+,pi0).
Upon closer examination all of them, including the one pictured
above, were eliminated.
With no viable candidates we were able to determine that the lifetime
of the proton,
for this decay mode, was at least 6.5 X 10^31 years.
This result was published in the
first IMB paper in 1953. The title page is shown below.
By this time the collaboration had grown to 29 members,
including 11 graduate students who contributed greatly to the
success of the project.
|
|

|
More and better pictures
at (UMDL)
Back to Top
The Continuing Search
|
In the years following these initial results the
search for matter instability was broadened to include monopole
catalysis of nucleon decay, neutron-antineutron oscillations,
and nucleon decay into a multitude (30-40) different modes.
The lifetime limits for some modes were pushed beyond 10^33 years.
(See Physical Review Letters 57 1986 (1986))
Since some of the rare decay modes would give rise
to much less Cherenkov light than the canonical (e+,pi0) mode it
was obvious that the search for such decays would be facilitated
by increasing the detector's light sensitivity.
A proposal to do this was presented to the Department
of Energy in the fall of 1983.
The proposal was approved in the summer of 1984 and over the next
two years we replaced the original five-inch PMT's with 2048 eight-inch
PMT's embedded in wave-shifter plates.
By September of 1986 we were taking data with four
times the sensitivity of the original detector. This allowed us
to set the trigger threshold down to 40 MeV,
about a factor of 25 below the signal that would be produced by
the (e+,pi0) mode.
Little did we know that a few
months later we were in for a big surprise.....
a surprise we would have missed if we hadn't upgraded our light
sensitivity.
The surprise had not to do with
matter instability but with the
gravitational
instability of massive stars.
|
|
Supernova
1987a
On the night of February 23, 1987 astronomers saw
something they hadn't seen for 400 years...
a supernova explosion close enough to be seen with the naked
eye. A massive "blue giant"
star, 50 times as large as our sun, had exploded in the Large Magellenic
Cloud (a small suburb
of our galaxy). The explosion actually occurred 150,000 years before...
it took that long for the light to get here.
When a large star has burned up all of the nuclear
fuel in it's center it becomes,
in a few seconds, an almost empty shell and suddenly collapses.
The rebounding matter and energy becomes a very dense, and very
bright, source of light.
Suddenly the object becomes hundreds of time brighter than its progenitor
star.
The "before"
and "after" pictures for SN1987a are shown below.
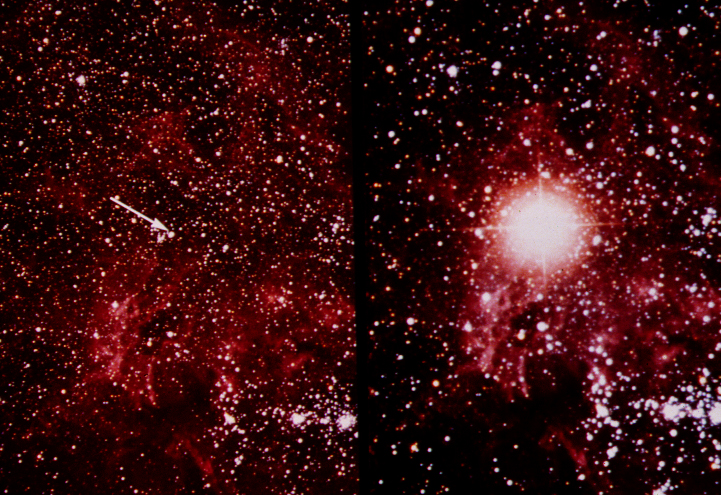
The arrow on the left shows the progenitor star,
Sanduleak -69 202.
The picture at right shows it shortly after the explosion.
(Most of the other bright objects in the photo are ordinary stars
like our sun.)
During the first few seconds of such an explosion
the temperature near the center is so
hot (10^10 deg) that huge numbers of neutrinos, electrons, and photons
are created.
The weakly interacting neutrinos are the only ones that can escape
easily so they carry away
most of the explosion energy.
The number of neutrinos emitted is extremely large...
about 10^57 escape in a few seconds.
After 150,000 years this pulse of neutrinos is spread out over the
surface of a sphere
150,000 light-years in radius.... big enough to encompass our whole
galaxy.
Spreading out the 10^57 neutrinos over the surface
of this huge sphere gives 10^13 neutrinos
per square meter. All of the neutrinos are contained in a thin shell
on the surface. The shell is only
a few light-seconds thick (about the distance from here to the moon).
Of the 10^16 neutrinos that went through the IMB
tank only 8 interacted with enough energy
to be detected.... all near the lower limit of our energy threshold.
The normal rate of events from atmospheric neutrinos at these low
energies was only about one
per week, so seeing 8 in a few seconds meant something truly unique
had happened.
Pictures of one of the events
in the IMB detector are shown below.
|

This shows the pattern of PMT hits
on the back (north-east corner). A 30 MeV neutrino interacted
with a proton in the water, producing a 28 MeV positron which
caused the PMT's to light up. (The blue and purple PMT hits are
random noise.)
|

In this view the long purple line is
the known neutrino direction coming from the Large Magellenic Cloud.
The short purple line going right is the positron direction and
the yellow squares show where its Cherenkov cone hit the north and
east walls.
|
|
When one considers that this pulse
of neutrinos had been racing towards us at the speed of light
for 150,000 years and that we were ready for it only a few months
ahead of time.....
it has to be called luck of the purest form.
But then, as they say, timing is everything.
Another 11 events, similar to
those in IMB, were detected deep underground
in Japan's Kamiokande detector at the same time.
These two experiments were the first
to see neutrinos from a supernova.
Hopefully they wont be the last, but it could well be another hundred
years before one
explodes close enough to be recorded in neutrinos.
These events gave a remarkable confirmation
of theoretical models of the physics of supernovae.
They also allowed unique measurements of the mass, lifetime,
and velocity of neutrinos.
Meanwhile, the pulse of neutrinos
from Sanduleak continues, at the speed of light,
on its merry way through our Milky Way galaxy....
perhaps tripping off other detectors being watched by other civilizations.
In another 100,000 years it will
have passed all of the 10 billion suns in our galaxy
( with their 10 billion "earths" ?)
and become too weak to be seen in some other far-away galaxy.
|
Below is the title page of
the announcement of SN1987a

More details can be found in Physical
Review D37 3361(1988)
More
and better pictures at (UMDL)
Back to Top
|
|