背景

Cumulative Distribution Function (CDF)累计分布函数

Probablity Distribution Function (PDF)概率分布函数
GeoGebra演示

未完待续…

文献

  1. VODCA
    LIU water resources
  2. Soil Moisture

示例

来源:https://www.researchgate.net/publication/271703152_Cumulative_Density_Function_CDF_matching_approach

Quantile_Mapp.png

Quantile_Mapp.png

Source code

matlab
function [SATCDF_ok,COEFF]=QMAPP(OBS,SAT)
%--------------------------------------------------------------------------
% CDF matching approach
% The function allows to rescale the input data (SAT) to match the
% Cumulative Distribution Function (CDF) of benchmark data (OBS).
%
% Major details can be found in :
% L. Brocca,S. Hasenauer, T. Lacava, F. Melone, T. Moramarco,W. Wagner,
% W. Dorigo,P. Matgen,J. Mart韓ez-Fern醤dez,P. Llorens,J. Latron,
% C. Martin,M. Bittelli (2011), Soil moisture estimation through ASCAT
% and AMSR-E sensors: An intercomparison and validation study across
% Europe, Remote Sensing of Environment,doi:10.1016/j.rse.2011.08.003.
%--------------------------------------------------------------------------

% loading benchmark data
load dataSM
D_OBS = OBS(:,1);
OBSdata=(OBS(:,2));

% loading data to modify
D_SAT = SAT(:,1);
SATdata=(SAT(:,2));
SATCDF_ok = NaN(length(SATdata),1);

for i=1:12 % for each month of the year
OBSmont = OBSdata(find(month(D_OBS)==i));
ID_SATmont = find(month(D_SAT)==i); SATmont = SATdata(ID_SATmont);

POBS = [1:length(OBSmont)]'./(length(OBSmont)+1);
PSAT = [1:length(SATmont)]'./(length(SATmont)+1);

% Interpolation of input data (SAT) to the same percentiles of
% benchmark data (OBS)
SATint= interp1(PSAT,sort(SATmont),sort(POBS),'linear','extrap');

% Computation of the differences between the CDFs of OBS and SAT data
DIFF=sort(OBSmont)-SATint;

% Fitting of a polynomial curve to DIFF
COEFF= polyfit(SATint,DIFF, 5);

% Evaluation of the polynomial curve to SAT data
SATCDF= polyval(COEFF,SATmont)+SATmont;
SATCDF_ok(ID_SATmont) = SATCDF;

% Comparison of cdf curves estimated for: benchmark data (OBSmont),
% data to modify (SATmont), corrected data (SATCDF)
set(gcf,'position',[ 530, 190, 1111, 794])
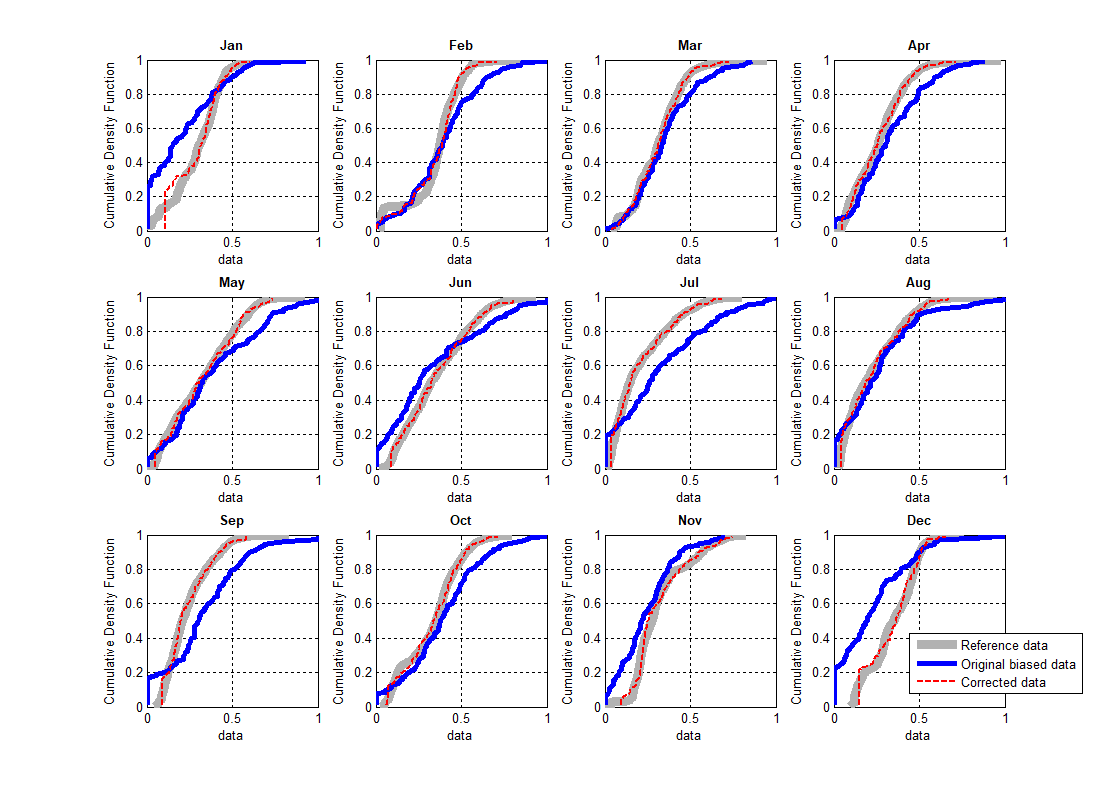
subplot(3,4,i)
plot( sort(OBSmont),(1:length(OBSmont))/(length(OBSmont)+1),'Color',0.7*[1,1,1], 'linewidth',7)
hold on
plot(sort(SATmont),(1:length(SATmont))/(length(SATmont)+1), 'b-','linewidth',4)
plot( sort(SATCDF),(1:length(SATCDF))/(length(SATCDF)+1), 'r--', 'linewidth',2)
xlabel('data'), ylabel('Cumulative Density Function')
monthTitle =['Jan';'Feb';'Mar';'Apr';'May';'Jun';'Jul';'Aug';'Sep';'Oct';'Nov';'Dec'];
title(monthTitle(i,:),'fontweight','bold','fontsize',10), grid on
if i==12, legend ('Reference data','Original biased data','Corrected data',4), end


M_STAT_OBS(i,1)= nanmean(OBSmont); V_STAT_OBS(i,1) = nanvar(OBSmont);
M_STAT_ST(i,1)= nanmean(SATCDF); V_STAT_ST(i,1) = nanvar(SATCDF);

end