It has been 511 days since the last update, the content of the article may be outdated.

背景

Cumulative Distribution Function (CDF)累计分布函数

Probablity Distribution Function (PDF)概率分布函数
GeoGebra演示

未完待续…

文献

  1. VODCA
    LIU water resources
  2. Soil Moisture

示例

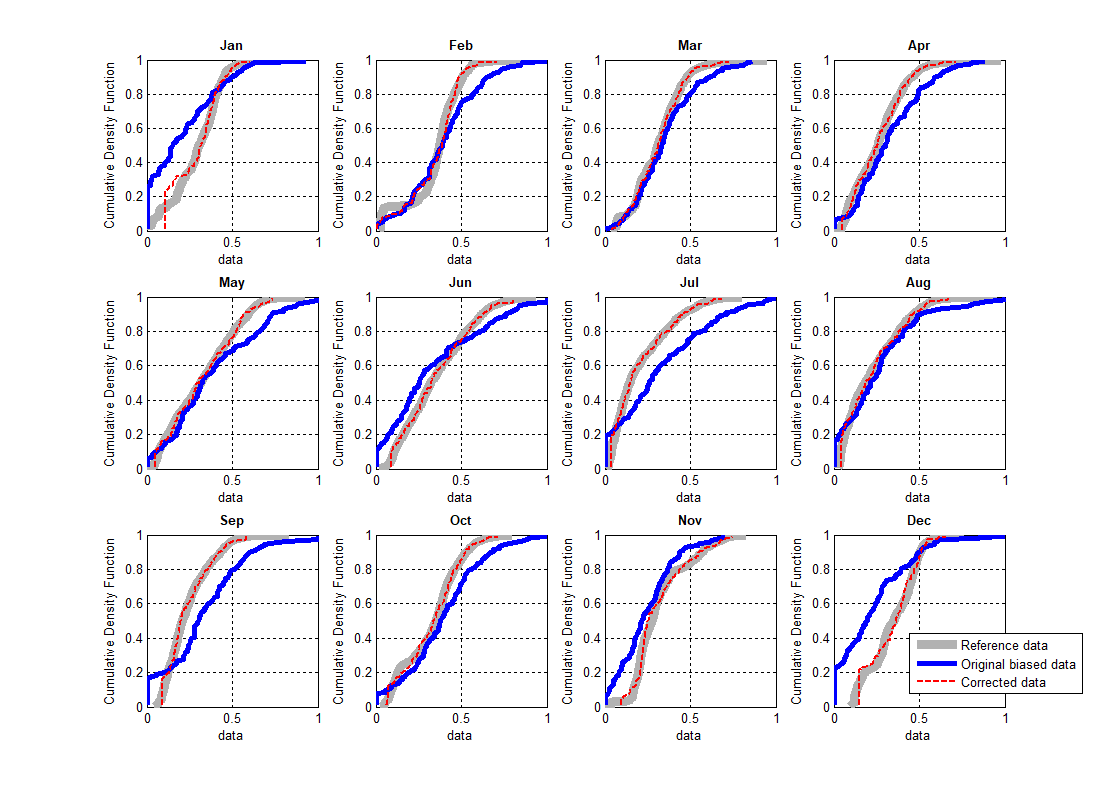
来源:https://www.researchgate.net/publication/271703152_Cumulative_Density_Function_CDF_matching_approach

Quantile_Mapp.png

Quantile_Mapp.png

Source code

matlab
function [SATCDF_ok,COEFF]=QMAPP(OBS,SAT)
%--------------------------------------------------------------------------
% CDF matching approach
% The function allows to rescale the input data (SAT) to match the
% Cumulative Distribution Function (CDF) of benchmark data (OBS).
%
% Major details can be found in :
% L. Brocca,S. Hasenauer, T. Lacava, F. Melone, T. Moramarco,W. Wagner,
% W. Dorigo,P. Matgen,J. Mart韓ez-Fern醤dez,P. Llorens,J. Latron,
% C. Martin,M. Bittelli (2011), Soil moisture estimation through ASCAT
% and AMSR-E sensors: An intercomparison and validation study across
% Europe, Remote Sensing of Environment,doi:10.1016/j.rse.2011.08.003.
%--------------------------------------------------------------------------

% loading benchmark data
load dataSM
D_OBS = OBS(:,1);
OBSdata=(OBS(:,2));

% loading data to modify
D_SAT = SAT(:,1);
SATdata=(SAT(:,2));
SATCDF_ok = NaN(length(SATdata),1);

for i=1:12 % for each month of the year
OBSmont = OBSdata(find(month(D_OBS)==i));
ID_SATmont = find(month(D_SAT)==i); SATmont = SATdata(ID_SATmont);

POBS = [1:length(OBSmont)]'./(length(OBSmont)+1);
PSAT = [1:length(SATmont)]'./(length(SATmont)+1);

% Interpolation of input data (SAT) to the same percentiles of
% benchmark data (OBS)
SATint= interp1(PSAT,sort(SATmont),sort(POBS),'linear','extrap');

% Computation of the differences between the CDFs of OBS and SAT data
DIFF=sort(OBSmont)-SATint;

% Fitting of a polynomial curve to DIFF
COEFF= polyfit(SATint,DIFF, 5);

% Evaluation of the polynomial curve to SAT data
SATCDF= polyval(COEFF,SATmont)+SATmont;
SATCDF_ok(ID_SATmont) = SATCDF;

% Comparison of cdf curves estimated for: benchmark data (OBSmont),
% data to modify (SATmont), corrected data (SATCDF)
set(gcf,'position',[ 530, 190, 1111, 794])
subplot(3,4,i)
plot( sort(OBSmont),(1:length(OBSmont))/(length(OBSmont)+1),'Color',0.7*[1,1,1], 'linewidth',7)
hold on
plot(sort(SATmont),(1:length(SATmont))/(length(SATmont)+1), 'b-','linewidth',4)
plot( sort(SATCDF),(1:length(SATCDF))/(length(SATCDF)+1), 'r--', 'linewidth',2)
xlabel('data'), ylabel('Cumulative Density Function')
monthTitle =['Jan';'Feb';'Mar';'Apr';'May';'Jun';'Jul';'Aug';'Sep';'Oct';'Nov';'Dec'];
title(monthTitle(i,:),'fontweight','bold','fontsize',10), grid on
if i==12, legend ('Reference data','Original biased data','Corrected data',4), end


M_STAT_OBS(i,1)= nanmean(OBSmont); V_STAT_OBS(i,1) = nanvar(OBSmont);
M_STAT_ST(i,1)= nanmean(SATCDF); V_STAT_ST(i,1) = nanvar(SATCDF);

end