Lesson Overview
Scheduled for launch in October 2016, the Cyclone Global Navigation Satellite System (CYGNSS) is a constellation of eight microsatellites that will use existing Global Positioning System (GPS) satellites to obtain estimates of surface winds near the core of hurricanes, including regions beneath the eyewall and intense inner-rain bands, that could not previously be measured from space. This information will allow NASA scientists and hurricane forecasters to provide improved advanced warning of hurricane intensification, movement and storm surge location/magnitude, thus aiding in the protection of human life and coastal community preparedness. Storm surge is an abnormal rise of water, over and above the expected water levels that would result from astronomical tides. In many cases, a significant fraction of a hurricane’s impact on a coastal community is related to the destructive nature of the storm surge associated with hurricanes.
Two measures of hurricane strength that are often reported by the National Hurricane Center (www.nhc.noaa.gov) are the "minimum pressure" and the "maximum sustained wind speed" associated with the storm. However, it is actually the gradient of the atmospheric pressure (that is, the change in atmospheric pressure over a given horizontal distance) that largely determines the speed of winds in our atmosphere. As a result, one of the major goals of this learning activity is to teach students about the relationship between atmospheric pressure gradient and wind speed.
While hurricanes occur infrequently, typically during the months of June through November in the Northern Hemisphere, the relationship between atmospheric pressure gradient and wind speed can be investigated throughout the year through the observance of the day-to-day changes in the weather conditions associated with transient, mid-latitude weather systems (that is, high and low pressure systems). For this reason, this learning activity uses the "natural laboratory" outside our windows to help students learn about atmospheric pressure, pressure gradient, winds and weather.
As students progress throught he elements of this learning activitiy, two specific Next Generation Science Standards will be addressed (see below). Rather than develop a narrowly-focused learning activity that only looks at pressure gradients and wind speeds in an near hurricances, we chose to expand the scope of this learning activity to allow students to apply these same concepts to the weather features they observe on a daily basis. As a result, this learning activity can be used to address each of the eight core "Practices for K-12 Classrooms" as described in the National Research Council document "A Framework for K-12 Science Education". These eight practices are:
1. Asking questions (for science) and defining problems (for engineering)
2. Developing and using models
3. Planning and carrying out investigations
4. Analyzing and interpreting data
5. Using mathematics and computational thinking
6. Constructing explanations (for science) and designing solutions (for engineering)
7. Engaging in argument from evidence
8. Obtaining, evaluating, and communicating information
Given the variety of activities included in this educational module, different elements of this module can be utilized in classrooms of every grade level.
Next Generation Science Standards
The following Next Generation Science Standards will be taught through this lesson:
K-ESS2-1. Use and share observations of local weather conditions to describe patterns over time.
Clarification Statement: Examples of qualitative observations could include descriptions of the weather (such as sunny, cloudy, rainy, and warm); examples of quantitative observations could include numbers of sunny, windy, and rainy days in a month. Examples of patterns could include that it is usually cooler in the morning than in the afternoon and the number of sunny days versus cloudy days in different months.
MS-ESS2-5. Collect data to provide evidence for how the motions and complex interactions of air masses results in changes in weather conditions.
Clarification Statement: Emphasis is on how air masses flow from regions of high pressure to low pressure, causing weather (defined by temperature, pressure, humidity, precipitation, and wind) at a fixed location to change over time, and how sudden changes in weather can result when different air masses collide. Emphasis is on how weather can be predicted within probabilistic ranges. Examples of data can be provided to students (such as weather maps, diagrams, and visualizations) or obtained through laboratory experiments (such as with condensation).
Background Information
Our atmosphere is made up of tiny molecules of nitrogen, oxygen and a number of other chemical species. These molecules are held near the Earth’s surface by gravity, a force directed toward the Earth’s surface. This strong and invisible force squeezes the air molecules closer together near the surface. As a result, the density of air (mass of molecules per volume) is greatest near the surface and decreases as one moves higher up in our atmospheric.
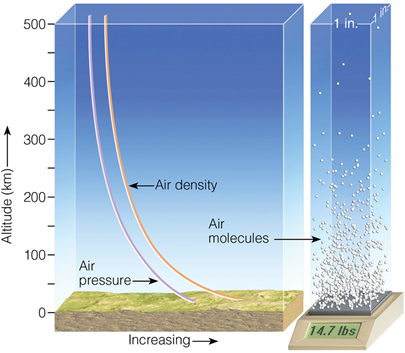
Source: Extreme Weather (Ahrens and Samson, 2011)
Air molecules have mass, and thus weight, which exerts a “force” on the surface of the earth. The weight exerted on a square area at the Earth’s surface, is known as the “atmospheric pressure” and is, on average, approximately equal to 14.7 pounds per square inch. Given that the density of air decreases as one moves higher up in our atmosphere, there are few molecules to exert a downward force (pressure) and thus the atmospheric pressure decreases with height. When looking at meteorological maps, other units of pressure are often used, such as millibars and inches of mercury. More information on the measurement of atmospheric pressure can be found in the learning materials provided below.
14.7 pounds per square inch = 1013.25 millibars = 20.92 inches of mercury
Source: Extreme Weather (Ahrens and Samson, 2011)
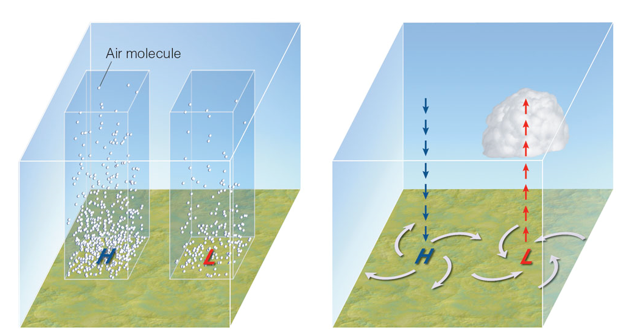
Due to a variety of factors, the pressure exerted by the atmosphere on the surface varies as one moves around the Earth. As a result, there are localized areas of “high pressure” and “low pressure” at the surface. Air flows from centers of high pressure toward centers of low pressure creating what we know as the wind. The greater the difference in pressure between the centers of high and low pressure, known as the "pressure gradient", the stronger the flow of air and thus the stronger the winds and thus wind speed. In the northern hemisphere, the wind flows outward from, and clockwise around, centers of high pressure. These winds then flow into, and counter-clockwise around, centers of low pressure. As the air comes together (converges) within low pressure centers, the air rises and can lead to the formation of clouds and precipitation, if the air is sufficiently moist.
For a more in-depth description the wind flow associated with high and low pressure systems, the reader is directed to the University of Illinois WX2010 Project.
ENGAGE
To begin this activity, the instructor should encourage students to investigate relationships between atmospheric pressure, winds and weather. Directed questions could include:
1. Ask the students to recall instances in which winds adversely impacted an activity that they participated in (sports, talking a walk, playing in a park or their yard, etc.)?
2. At what time of the year did the activity occur?
3. What were the overall weather conditions were at the time of that activity? Was it a sunny day? Was it a storm day?
Ask students to share these experiences in small groups, then bring the discussion back to the larger group. If more than a few students can recall examples, the students should come to realize that windy conditions can occur at any time during the year and can be associated with just about any type of weather. Why? The reason is that the speed of the wind depends on the horizontal gradient in atmospheric pressure (that is, the change in pressure with horizontal distance), not the absolute magnitude of the pressure.
In the activity which follows, the students will explore the relationships between atmospheric pressure, pressure gradient, wind and weather. This exploration will begin with the students looking for these relationships using a series of three maps from approximately 1500Z (1100 EDT) on 28 October 2014. Afterward, the students will be invited to make series of weather observations over the course of a one to two week period, during which time they will take daily observations of the weather and compare their observations with those shown on a series of weather maps. The length of time that these observations are made is completely up to the teacher and depends upon the extent of the content that the teacher wishes to engage the students in. As the students obtain a better understanding of these relationships over the observation period, the students will be able to predict the general nature of the wind (calm, light, moderate, strong) that can be expected within their community over the next 24 hours.
EXPLORE
Using the weather maps shown below, ask the students to look for relationships between winds (speed and direction), weather (cloud cover and precipitation), atmospheric pressure maxima (high pressure systems) and minima (low pressure systems) and horizontal pressure gradient. Depending upon the grade level of the students participating in these activities, it may be appropriate for the students to only look at a subset of these weather elements. Each of the maps corresponds to roughly the same time (1500 UTC = 1500 Z = 1100 AM EDT).
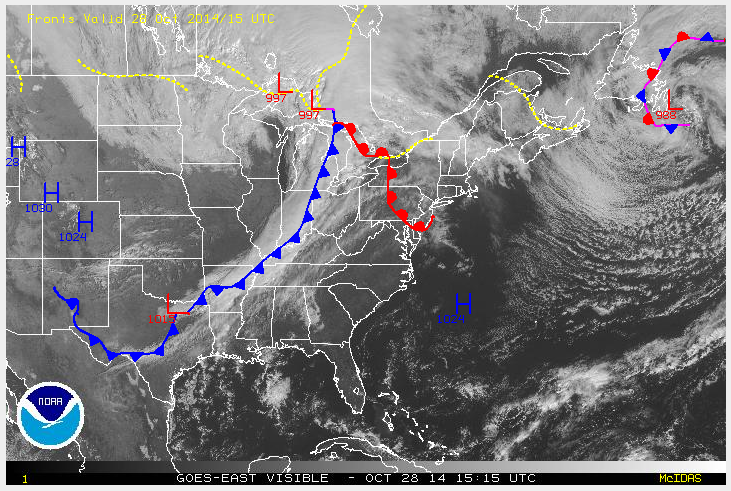
Figure 1. Visible satellite with surface pressure centers and fronts.
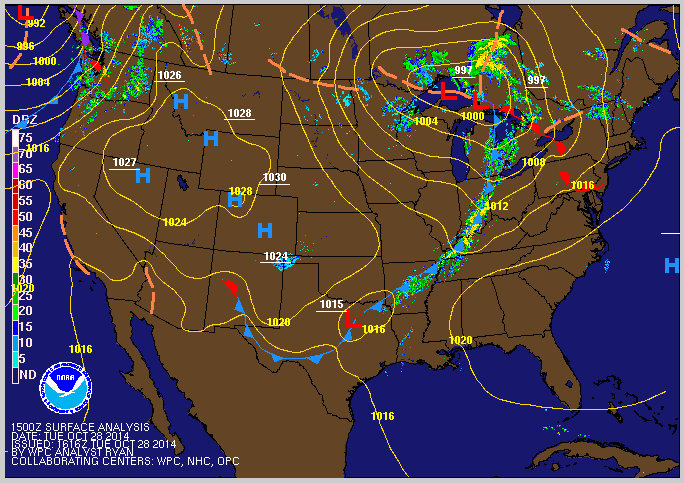
Figure 2. National radar with surface pressure centers and fronts.
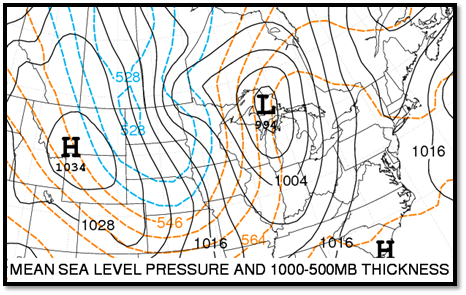
Figure 3. National surface map with surface pressure centers and fronts. Brown contours represent lines of constant pressure in millibars.
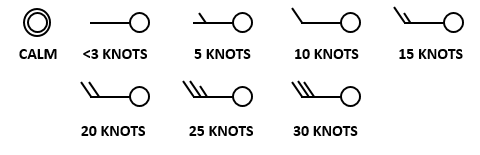
Figure 4. Wind speed symple key for use with Figure 3.
After the students have had an opportunity to investigate possible relationships, directed questions could include:
1. Are clouds generally associated with areas of atmospheric pressure maxima (high pressure systems) or minima (low pressure systems)? Students should be able to utilize the figures provided in the background section (Ahrens and Samson 2011) to provide an explanation for this observation.
2. The contours on the surface map presented in Figure 3 represent areas of equal atmospheric pressure. These lines are called "isobars". A single contour, or isobar, is observed across Wyoming, suggesting very little change in atmospheric pressure as one moves from west to east across the state. There are several contours observed across North Dakota, suggesting a greater change in atmospheric pressure across that state. What are the winds speeds observed in areas with little horizontal pressure change (Wyoming) compared to areas with a large change in atmospheric pressure (North Dakota)?
Local Weather Observations Activity
The following portion of this learning activity has been developed to help students further explore and understand the concepts presented above through the use of daily weather observations that the students can perform at home or in school. As noted earlier, these activities can be used by a wide range of age groups and can be used in part, or in whole, in order to support teacher specific learning goals.
Observations
For a one to two week period, the students will be asked to take daily weather observations at the start of the school day and then record their measurements. In particular, the students should observe and record the atmospheric pressure, present weather (clouds, precipitation type) and estimated wind speed.
a. The atmospheric pressure at your location can be obtained either using a barometer or weather station located at your school, the internet, a local radio/television station, or the nearest NOAA Weather Radio Station.
b. The present weather at your location can be obtained through visual observation, weather station at your school, the internet, a local radio/television station, or the nearest NOAA Weather Radio Station.
c. The wind speed at your location can be obtained through visual observation or weather station at your school, the internet, a local radio/television station, or the nearest NOAA Weather Radio Station.
The students' observations should be recorded on the "Atmospheric pressure, wind and weather log sheet" (Items #1 or #2) provided in the link below. A teacher resource on how to make atmospheric pressure measurements using an aneroid barometer has been produced by the GLOBE Program and is provided below (Item #3). Some teachers may wish to expand the scope of the weather measurements to clouds and precipitation. While space is not included for this information on the "Atmospheric pressure, wind and weather log sheet" provided below, protocols for these measurements have been produced by the GLOBE program, as well, and are provided below (Items #4 through #6). For schools which wish to make visual observations of wind speed without the use of instrumentation, a handout has been prepared for use that is based up on the Beaufort Wind Force Scale (Item #7). The observations made using these resources can then be compared with the AMS Datastreme Surface Weather Map (Item #8), which provides a graphical view of areas of high and low pressure, surface fronts (warm, cold, stationary and occluded) and precipitation, updated once every three hours. Finally, advanced students (or grade levels) can take advantage of AMS Datastreme Surface Pressure Maps (Items # 9 and #10) to investigate the relationship between atmospheric pressure gradient and wind speeds, comparing these gradients with the observed wind conditions at their location. Item #9 contains plotted surface pressure data, while Item #10 contains the same data with isobar contours drawn in. While some teachers may chose to use the plotted and contoured maps to investigate the atmospheric pressure gradient/wind speed relationship, other may use the non-countoured map (Item #9), so as to allow the students to get experience contouring scientific data. In this case, Item #10 can serve as an "answer key" for the students attempt at contouring the data using Item #9.
Materials for Local Weather Observations Activity
The following materials will be used as part of this lesson:
1. Atmospheric pressure, wind and weather log sheet (Pressure range: 940 to 1040 mb)
This handout allows students to record daily observations of atmospheric pressure, wind and weather for a one week period.
2. Atmospheric pressure, wind and weather log sheet (Pressure range: 880 to 1040 mb)
Nearly identical to the previous handout, this handout includes an expanded range of pressures for those areas that could experience the extreme low pressures associated with tropical storms.
3. GLOBE Barometric Pressure Protocol
This protocol answers the question "What is meant by atmospheric pressure?", and details how to make the measurement. A "Teacher Support" section is included.
Some classes may choose to expand their weather observations to include the daily observation of cloud coverage and type. This handout provides a discussion on the link between clouds and weather, as well as information on how to make cloud measurements. A "Teacher Support" section is included.
This color pictoral chart provides examples of clouds from each of the major cloud families: High, Middle, Low and Low with Vertical Development. Explanative text is included in English, Spanish and French.
6. GLOBE Precipitation Protocols
Some classes may choose to expand their weather observations to include the daily measurement of preciptiation. This measurement can also be used in support of discussions of the Earth's hydrological cycle. This handout discusses the basics of precipitation formation, as well as how to measure both liquid (rain, drizzle) and frozen (snow, sleet) forms of precipitation. A "Teacher Support" section is included. Further exploration of precipitation and the hydrological station can be facilitated through educational pages of NASA's Global Precipitation Measurement (GPM) mission, found here.
7. Beaufort Wind Force Scale Table
The primary focus of this educational module is the development of the student's understanding of the linkage between atmospheric pressure gradient and wind speed. While wind speed information can be obtained from on-site weather stations, radio, television or the internet, the Beaufort Wind Force Scale Table provides a simple way of allowing students to categorize the wind using their personal observations of their physical surroundings. Originally developed for use at sea in the early 1800's, the scale was eventually modified for use on land.
8. AMS Datastreme Surface Weather Map
The American Meteorological Society's Datastreme Project provides an excellent online data resource for K-12 teachers that are interested in teaching elements of weather systems to their students. This link provides an analyzed surface map (updated every three hours) that includes surface weather observations (including pressure and wind) at a number of locations, radar data and contours of constant pressure (isobars).
9. AMS Datastreme Surface Pressure Map (without contours)
Some classes may chose to focus only on the relationship between surface atmospheric pressure, pressure gradient and winds at their location. This link provides students with a map containing solely observations of atmospheric pressure. This map allows the students to learn how to contour data fields on a map, using that contoured analysis of the horizontal atmospheric pressure field to determine the magnitude of the surface atmospheric pressure gradient at their location. This gradient can then related to their local wind observations.
10. AMS Datastreme Surface Pressure Map (with contours)
Some classes may chose to focus only on the relationship between surface atmospheric pressure gradient and winds at their location. This link provides students with a map containing solely observations of atmospheric pressure, plus a pre-contoured analysis of the horizontal atmospheric pressure field that helps students to detrmine the magnitude of the surface atmospheric pressure gradient at their location. This map can also be used as the answer key for classes which use the previous map to learn how to contour data fields on a map.
11. GLOBE Map Contouring Protocol
For those classes which choose to use the AMS Datastreme Surface Pressure Map without contours, this GLOBE Protocol provides instruction on how to contour scientific data such as surface atmospheric pressure.
EXPLAIN
In this portion of the activity, student are asked to construct explanations for their observations based upon the various concepts that they are exploring and learning. For some students, these relations may simply be associated with the relationship between atmospheric pressure and timing and type of passing weather systems. For other students, these relations may be as complex as the relationship between horizontal pressure gradient and wind speed.
ELABORATE
Based upon the observed relations between atmospheric pressure, horizontal pressure gradient, winds and weather, the students should be encouraged to build conceptual models that can be used to predict what weather conditions might be expected in their community over the next 24 hours. Returning to the students' previous discussions in the ENGAGE section of this activity, students should be encouraged to consider how the conditions they are predicting are likely to impact the local community (possibly not at all, or resulting in power outages, travel delays, or postponment in outdoor activities of events). Further, teachers could ask the students to think about how their ability to predict the weather conditions in advance can help their community plan for such conditions.
Finally, teachers are encouraged to provide a linkage back to the overall goals of the CYGNSS Project. Namely, through the measurement of surface wind speed within the core of hurricanes, CYGNSS seeks to obtain a better understanding of the processes that lead to the intensification of hurricanes. Much in the way that the students' forecasts can help their families and communities to be better prepared for hazardous weather, the CYGNSS mission will allow NASA scientists and National Hurricane Center forecasters to better predict the intensity of landfalling hurricanes, thus allowing communities to more effectively protect human health and welfare.
EVALUATE
While the activities presented in this learning module can be applied to several learning goals expressed with the NGSS, the most direct linkages are with K-ESS2-1 (Use and share observations of local weather conditions to describe patterns over time.) and MS-ESS2-5 (Collect data to provide evidence for how the motions and complex interactions of air masses results in changes in weather conditions.).
To assist teachers in performing an assessment on student learning during these activities, the following assessment actitivities have been developed:
1. K-ESS2-1
2. MS-ESS2-5
REFERENCES
Ahrens, C.D. and P.J. Samson (2011): Extreme Weather & Climate. Belmont, CA: Brooks/Cole, Cengage Learning.