RESULTS: Angular Kinematics
Segment angle. The foot segment
angle was measured for both high-heeled and normal gait. The minimum
angle occurred just after heel strike as the foot has completed the
dorsiflexion movement, and the maximum angle occurred right after toe
take off as the foot had plantarflexed. Larger angles were measured
for the high-heeled gait because of the increased angle caused by the
high-heeled shoes. The range of motion for the normal gait movement
was 81 degrees, with a maximum of 188 degrees and a minimum of 107
degrees. The high-heeled movement the range of motion was 71 degrees,
with a maximum of 197 degrees and a minimum of 128 degrees.
|

|

|
|
Figure 3. Foot segment angle during the normal gait
(left) or the high-heel gait (right). The segment angle is
calculated from a hypothetical plane passing horizontally
through the ankle joint in the frontal plane, and parallel
to the ground. The anatomical position for the ankle joint
is 90 degrees. In both graphs increasing angles indicate
clockwise rotation, while decreasing angles indicate
counterclockwise rotation.
|
Joint angle 1. The knee joint angle
for both movements (normal and high-heeled gait) was analyzed for
comparison. The maximum for both movements was about 180 degrees.
This was achieved during the stance phase of both movements. During
this phase the knee becomes completely extended, flexes a little and
then extends once more before toe take off. This explains the slight
dip and rise before the swing phase forced flexion at the knee.
During extension, or swing phase, the minimum angle for the normal
gait movement reaches 116 degrees, while the minimum angle reaches
125 degrees for the high-heeled gait movement. The range of motion
for the normal gait movement was 65 degrees, while the range of
motion for the high-heeled gait was 55 degrees.
|

|

|
|
Figure 4. Knee joint angles in the normal gait (left) and
the high-heel gait (right). The angle is calculated from a
vertical line passing through the thigh and lower leg
segments. The anatomical position for the knee joint is 180
degrees. An angle less than 180 degrees corresponds to
flexion and an angle greater than 180 degrees corresponds to
hyperextension.
|
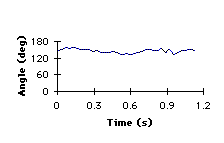
Joint angle 2. The ankle motion that
is seen between the normal gait and the high heel gait is very
similar in timing but is much different in angle size. The maximum
angle for the ankle in the normal gait peaks at 125 degrees. This
angle is seen approximately 75% into the motion when the ankle is
planter flexed while in swing phase preparing for heel strike. The
maximum angle in the high-heel gait peaks at 155 degrees. Just as
seen in the normal gait, the peak in the ankle joint is seen during
the planter flexion approximately 75% into the motion. This also, is
during the swing phase, preparing for heel strike. The minimum ankle
angle in the normal gait was 100 degrees approximately 48% through
the motion. This angle is in direct correlation with the dorsi
flexion associated with the stance phase. The minimal angle seen in
the high-heel gait is 110 degrees 48% through the motion. Once again
dorsi flexion occurs in correlation with the stance phase of the
motion. The range of motion in the normal gait is 25 degrees, while
the "ROM" in the high-heel gait is 45 degrees.
|

|
|
|
Figure 5. Ankle joint angles in the normal gait (left)
and the high-heel gait (right). The angle is calculated from
the lower leg and foot segments. The anatomical position of
the ankle joint is 90 degrees and the angle was measured
clockwise from the lower leg segment to the foot segment.
Decreasing ankle angles represent dorsiflexion. Increasing
angles greater represent plantarflexion.
|
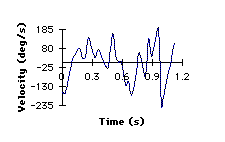
Joint velocity. The angular joint
velocity was similar for both the normal gait and the high-heeled
gait. Positive values correspond to plantarflexion and negative
values correspond to dorsiflexion. There appears to be much more
dorsiflexion in the normal gait action than in the high-heeled gait
as there are six minima in the normal gait graph and only four in the
high-heel gait graph. The initial peak in both graphs represent heel
strike for both actions as we started analyzing the motions at this
point. For the normal gait, the maximum angular velocity approaches
148 deg/s, and the minimum angular velocity is about 171 deg/s. For
the high-heeled gait these numbers change quite a bit as the maximum
angular velocity approaches 184 deg/s, and the minimum angular
velocity is around 235 deg/s.
|

|
|
|
Figure 6. Ankle joint angular velocity in normal gait
(left) and in high-heel gait (right). Positive values
represent plantarflexion and negative values represent
dorsiflexion.
|
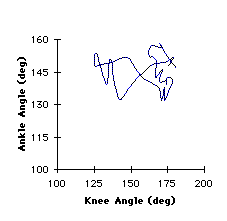
Angle-Angle Plot. The coordination
of the knee and ankle was different in normal gait and high-heeled
gait. The graphs below, of ankle angle versus knee angle, represent
the combined action of both ankle dorsiflexion and plantarflexion,
and knee flexion and extension. In the normal gait stance phase the
knee had flexed while the ankle at first plantarflexed and then
dorsiflexed. In the swing phase of normal gait the knee extended and
the ankle dorsiflexed and then plantarflexed to complete the cycle.
In high-heeled gait during the stance phase the knee was flexed and
the ankle again shifted from the initial plantarflexion to
dorsiflexion. During the swing phase of the high-heeled gait the knee
again extended while the ankle went from dorsiflexion to
plantarflexion to once again complete the cycle. Because knee motion
was very similar in both normal gait and high-heeled gait the
differences in the graphs depict the differences in ankle motion. In
both cases the graphs appeared to have a rough sideways figure eight
appearance to them because they both represented a single cycle
(plantarflexion- dorsiflexion-plantarflexion) of the ankle movement.
The high-heeled graph occurs at higher ankle angles because of the
increased ankle angle the high-heels cause. The jumbled region in the
upper right of each graph represents the heel strike of the movement,
at this point the foot absorbs some impact and the ankle angle begins
to decrease sharply. The other jumbled region in the bottom right of
each graph represents toe take off, and at this point the ankle angle
starts to increase rapidly.
|

|
|
|
Figure 7. Coordination of the ankle joint angles and the
knee joint angles in the normal gait (left) and the
high-heel gait (right). The arrow points to the direction of
the recorded gait in each movement. Increasing ankle angles
correspond to plantarflexion, while decreasing ankle angles
correspond to dorsiflexion. Increasing knee angles represent
extension and decreasing knee angles represent flexion.
|