
TRANSPORTATION NETWORKS IN TURKEY: AN APPLICATION OF GIS
BUFFERS AND CONTOURS
Z. Asligul Gocmen
Ph.D. Student, Urban and Regional Planning Department, University of Michigan
Ann Arbor, Michigan 48109
Phone: (734)763-3075 Fax: (734) 763-2322 E-mail: zgocmen@umich.edu
Abstract:
There have been several studies on the determination of the locations of transportation networks on national scales. Geographic information systems are becoming essential spatial tools in policy studies. However, data availability is a critical issue in the utilization of GIS, particularly in developing countries. Nevertheless, existing worldwide data can be useful in various analyses. Digital Chart of the World which contains information on the natural and cultural features including topography, cities, and existing transportation systems on a national level may be utilized when there are no other available data.
This study is an investigation of the current transportation network, particularly the railway network in Turkey with the purpose of developing recommendations for the location of possible upgrades. To provide such recommendations, the railway network is related to population change through application of spatial analysis.
The study uses historical data and a derivative of a method developed in 1970 and is applied to current conditions in Turkey. It employs GIS methods not available for the earlier studies. The Digital Chart of the World is the data source and appropriate GIS techniques are used to operationalize the model. This approach is one way to address the problem of data deficiency in developing countries.
TRANSPORTATION NETWORKS AND DEVELOPMENT
Transportation networks have been major means to access people, jobs, various activities, and even information. Even though the information age and technologies require less emphasis on transportation networks as a means for development, studies show that transportation is a means for flow of information which might lead to development as well (Arlinghaus, Goodman, and Jacobs, 1997).
Transportation networks have clearly played important roles in the development of nations and regions (Jefferson, 1928, Taeffe, Morrill, and Gould, 1963, Hoyle and Knowles, 1992). Mark Jefferson, in his 1928 article "The Civilizing Rails" has shown the strong relation between the rail network and cultural and economical conditions of different countries in the world. Taeffe, Morrill, and Gould, in their model for Ghana and Nigeria, display the parallel development of transportation systems and the economic centers of these countries. In a more recent study, Hoyle and Smith present the interconnectedness of transportation and socio-economic systems from a regional to global perspective by various case studies.
In the development of early 20th century network systems, rail systems were the pioneer. However, the last few decades experienced a decline of the importance of railways and hence the development of new arteries throughout the world due to the increased construction of roads and highways. In developed nations, where the automobile and truck are the primary modes of transportation, such shifts in the transportation modes may not affect regional development to the same extent as they might in the developing world.
A major component in determining the location of new transportation routes or upgrading the systems is the demand for transportation. Demand may be based on the demographic and economic structure of the localities as well as on the physical structure including the topography and spatial distribution of the localities. General population figures would lead to a simple hypothesis of the demand, indicating that higher populated places generate higher demand for travel. Most traveled paths are the most improved pathways that link most populated places but then improved pathways invite new settlements that change the pattern of demand. Improved transportation capacity is a necessary component of regional development.
In the light of this argument, it could be said that a nation’s transportation network should be designed so that it would allow access to the highest number of people. However, such conclusions could leave the least populated and probably the least developed regions aside. Therefore, efforts to design transportation networks in the developing world should incorporate the development plans based on socio-economic conditions of regions as well as the demand for transportation.
The Case of Turkey – A Historical Perspective
Turkey, on the contrary of being at the physical and cultural crossroads of East and West does not display a very developed transportation system. The development of the transportation routes was based on trade and administrative matters, as well as relations with neighboring countries. The following analysis is primarily based on the rail network.
The Ottoman period, 1299 – 1923 AD, experienced little emphasis on surface transportation development due to the popularity of sea transport and the lack of social ties between the urban-centered Ottoman elite (particularly located around Istanbul and western Turkey) and the rural Anatolian society. Since the construction of the first line in 1860, a little less than 4,000 kilometers of railroads were built in the entire country.
After the collapse of the Ottoman Empire which corresponds to the end of World War I, and the establishment of the Turkish Republic in 1923, the boundaries of the nation were defined and regional development efforts were shifted towards the central and eastern Anatolia from the western regions. One such effort was to move the capital from Istanbul to Ankara. With the republic, massive efforts were given in the name of modernization in the late 1920s through 1940s, During that period, 2,530 kilometers of railroads were built, connecting mainly the inland centers. During the same period, a lot of investment was made in the modernization of agriculture, improvement of education, and industrial development. Construction of highways was in place as well.
Since 1940s, rail development has declined throughout the country. This can be traced from the figures that indicate only 1165 kilometers of railroads were constructed. Despite the efforts to develop towards the eastern part of the country, the rail network east of Ankara still remains to be less developed than the western regions (see Figure 1). Most of the transportation investment has been in the highways, still not quite corresponding to world standards. All around the country, the highways are not very wide, and cannot safely meet the flow of the vehicles in certain areas. Traffic accidents are a major cause of death or injuries. In addition, most intercity roads are two lane roads with one lane in each direction, making it even more prone to accidents. The only highways in the form of autobahns are between Istanbul and Ankara (around 400 km), most heavily populated cities of the country, and between Izmir, the third largest city and one of its towns, Cesme, approximately 75 kilometers apart.
Figure 1: Rail network in Turkey
Safety issues are not the only concern of transportation studies in Turkey. It is a country in transition in many aspects: demographic, urbanization, industrial, and others. It is 65% urbanized with the cities of 100,000 or more populations growing most rapidly. The country displays large differences in the social, economical, and physical spaces. 43 million of the 63 million total
population of the nation lives in the western regions, including central Anatolia region. Istanbul displays the characteristics of a primate city with its population and industrial base. With the surrounding settlements, Istanbul accommodates one fifth of the nation’s population and half of the nation’s industries. The most populated province is Istanbul with 9 million people, followed by Ankara and Izmir. The least populated provinces are Kilis, Bayburt, and Tunceli, the latter having 82,000 people. The Eastern regions contain more physical barriers than the western regions.
The absence of a highly developed rail system, safety issues, rapid urbanization and concentration in large cities, and regional imbalance are various reasons contributing to the purpose of examining the Turkish transportation, particularly rail network.
ANALYSIS OF TURKISH RAIL NETWORK
In order to analyze the rail network in Turkey and provide recommendations, the methodology, techniques, and data sources are discussed below.
Methodology
The analysis used in this study are comparisons of the existing network with historical railroad development and with a simulated network based on the distribution of population of 1960 and major physical barriers in Turkey. A comparison between the existing network and the one depicted in Jefferson’s maps serve to underscore the lack of development of railroads in Turkey in relating to those of Europe.
The historic maps, created by Jefferson in 1928, display continents and 10 miles of buffers around the railroads. Jefferson’s reasoning for the 10 mile buffers was related to transport means of this time: a person could travel 10 miles in a given day by foot, by ox-carts, and similar means that were available to get to the railroads. In the analysis of the rail network of Turkey, 10-mile buffers were chosen for historic comparison purposes, although the advancement of the technology would enable a longer travel distance per day to access railroads. One other consideration is the fact that the backwardness of the eastern-rural Turkey and the harsh physical terrain would restrict a travel distance greater than 10 miles.
Buffered maps are used to display the proportion of the country’s land area, as well as population that has easy access to rail network. In addition, utilization of the railroad networks in Turkey compared with Europe, might show the status of transportation network in a developing country versus developed ones.
A 1970 study on Turkish rail network, performed by Kolars and Malin, takes Jefferson’s analysis as a starting point and provides a simulated network based on 1960 census and major topographical barriers. Then compares the simulated network with the existing network at the time of the study. This study compares existing conditions and the findings of Kolars and Malin in order to provide recommendations for the rail network in Turkey.
This study undertakes a similar approach to Kolars’s and Malin’s analysis and also incorporates Jefferson’s historical maps to discuss in more detail the current railroad system in Turkey.
Techniques Utilized
This study utilized geographic information systems as the main tool in the analysis. In fact, operationalization of GIS in this project was a major objective to display the ease of similar spatial analysis with such tools that were not available during both of the original studies.
Two software packages of Environmental Systems Research Institute (ESRI) were used: ATLAS GIS and ArcView 3.1, most of the analysis being in ArcView. Buffering of the railroads was done in ATLAS due to the large data and easier feature of buffering in ATLAS. Then the buffer file was transformed into ArcView shapefiles and used in ArcView in further analysis. In addition, the data from Digital Chart of the World were obtained in ATLAS and then transformed into ArcView.
ArcView 3.1, with the Spatial Analyst extension, made different contouring and surfaces possible in the determination of the population peaks. Instead of many hours spent by Kolars and Malin in the determination of these peaks, it was a matter of minutes for ArcView to calculate them. The map of barriers from Kolars and Malin was scanned and rectified as a data source to digitize major physical barriers.
Data
Most of the data utilized in this project was obtained from the Digital Chart of the World (DCW) database. DCW is based on the military data and is available for any country in the world. The data used in this project is from 1993. The data source contains various layers including land covers, physical features such as lakes, rivers, topographic contours, population centers in different sizes, transportation networks (both railroads and roads), and electric lines which were all used in this study.
Nevertheless, there were few problems related to the data. First of all, 3,550 population centers in Turkey were entered in the database and were classified in three different layers. There were no population figures attached to the centers. In addition, some of the centers did not have their names and the naming convention was not very consistent. Some centers were entered in capital letters and the others in lower case and the size did not seem to be the determinant in few cases for this differentiation. Based on a pilot study on the population layers for the region of Thrace, defined by the two straights (Bhosphorus in Istanbul and Dardanel in Canakkale), and the northwest boundaries of the nation, above 50% of the centers did not have a name in the database file and among the four provinces in that region, one of them was not in the database at all. Thus, the decision was made to utilize only the province centers in the study. Total populations as well as the populations in the central cities of the 80 provinces of the nation were assigned to their centers. The data for their population, from 1997 census was gathered from the web site of the State Statistical Institute of Turkey.
Results of the Rail Network Analysis in Turkey
Examining Jefferson’s map from 1928, it is not very hard to trace the cultural and economic development with relation to the railroad systems. In that year, Western and Central European countries including France and Germany were covered by rails and buffers and there were modest developments penetrating into the Southern and Eastern Europe (see figure 2).
A 1993 Jefferson style map (figure 3)shows a similar build-up in those nations and into Eastern Europe and Russia as well. Turkey displays relatively small changes. The comparison of the buffered areas in Turkey to the total of Europe and most part of the Union of Soviet Socialist Republics shows that the difference in the covered land is significant.
Another analysis was done using the electric lines to compare the conditions of Turkey and Europe as a whole and to display the development of technology in Turkey. The ratio between the electric lines to railroads in Europe is 1.35 and this ratio is 3.63 in Turkey. Both of these indicators attempt to capture the lag of rail development in Turkey.

Figure 2: Jefferson’s Europe with 10 mile buffers around the railroads, copyright Mark Jefferson, 1928.

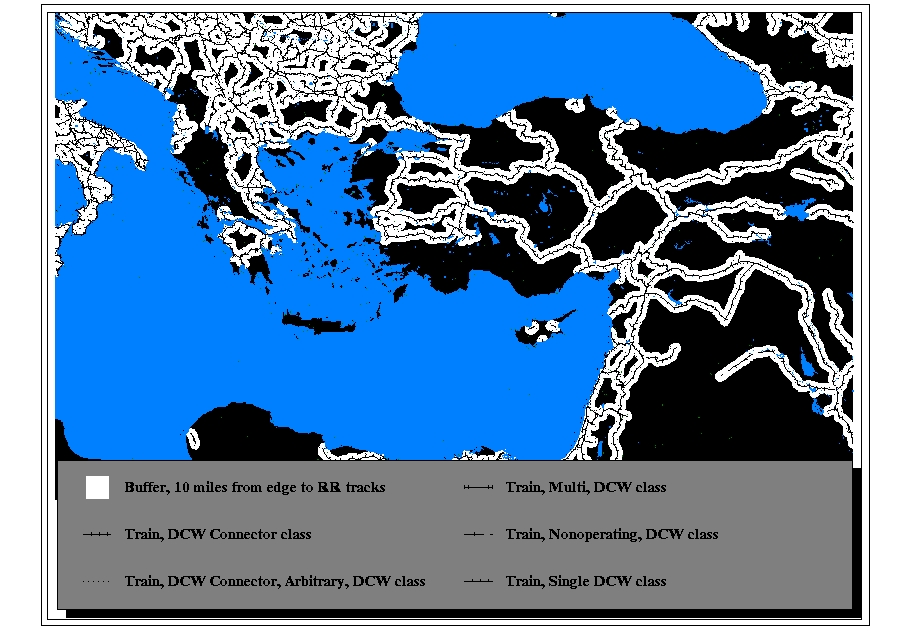
Figure 3: 10 mile buffers along the railroads based on 1993 data.
Then, an analysis was performed using the buffered rail lines in Turkey (figure 4) which showed that among the 80 province centers in Turkey, 48 are within 10 mile distance and among the 3,550 population centers of DCW database, 1,110 were within the same distance. The significance of 32 provinces that are not within the 10 mile buffer lie in the fact that 25 of them are to the east of Ankara, the less developed region in the country. The total population of the provinces within the 10 mile buffers corresponded to 49 million of the total population of 63 million leaving 38% of the population not in proximity to the network. Among the 27 million people who live in the province centers, almost 24 million of them (which also corresponds to 38%) lived in cities within the 10 mile buffers.
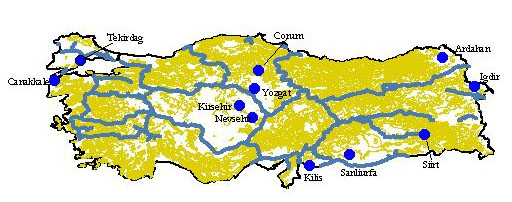
Figure 4: Spatial distribution of province centers with respect to 10 mile buffered railroads.
Examining the study and results by Kolars and Malin might provide a better understanding of the population dynamics and simulation of networks. In that study of 1970, the unit of analysis for the population was the county and each county population was assigned to the county seat. An isopleth map was prepared based on 636 counties and using 25 mile distances. The result of the isopleth map was a new population map of Turkey, displaying peaks (major cities), plateaus (well-populated rural areas), and pits (least dense areas). The peaks were joined using the gravity model, and computing the interaction between two nodes based on the population of each and the distance between them. Some routes were combined based on efficiency and a redundant network was designed to ensure connection for each population peak. The network then was modified based on the major topographic features. The comparison of this simulation and the existing network showed that apart from few segments, particularly around the borders of the country, simulated network was a good fit of the existing network. The misfit close to the borders of the country was due to the initial criteria for the study: the nation was assumed to be a closed system, with the transportation activity taking place within the country only (figures 5 through 7)

Figure 5: Simulated rail network based on population pressure points, 1960 data, Kolars and Malin, 1970

Figure 6: Simulated rail network based on population and major physical barriers, 1960 data, Kolars and Malin, 1970.

Figure 7: Comparison of the existing and simulated rail network, Kolars and Malin, 1970.
The analysis of the distribution of population in the province centers indicates that the initial study performed by Kolars and Malin could actually reflect today’s population structure (see figures 8 and 9 for a comparison). As mentioned earlier, in Kolars’s study, the simulated model was based on the interaction obtained from a gravity model. The analysis of the current population distribution did not necessitate the utilization of that model. The preliminary analysis was based on the contouring of the province centers based on the total population of the provinces. Since 85% of the population who live in the province centers are within easy access of the rail system, the emphasis needed to be in the total population surrounding or encompassing the rural areas as well.
Figure 8: Population distribution based on total populations assigned to the province centers, 1997 data.

Figure 8: Population distribution based on the population of counties assigned to their seats and the results of the gravity model, 1960 data, Kolars and Malin, 1970.
Examination of the 1960 and 1997 population figures shows that spatial distributions of the population in both years are very similar with few differentiations. For example, the emergence of a southeastern province, Diyarbakir as a population pressure point is promising for the development of that region despite the existing safety issues. Istanbul and its environs continue to be the highest population points followed by Ankara. In the case of the Black Sea region and mainly Trabzon, a decrease in the population is depicted. The harsh physical conditions as indicated in the following paragraphs and in figure 9 as well as the differences in the unit of analysis (province centers versus county seats) may have contributed to these differences particularly.
Twenty-two province centers were chosen based on their likelihood to be peaks after creating the contours (see figure 9). Among these 22 centers, only one of them, Yalova was not on a rail line, which showed that a rail system grounded on population distribution in Turkey would be a very good representative of the existing system. Yalova has a total of 162,000 population and ranks as the 74th populated province in the country. However, due to the proximity to Istanbul and other provinces as Bursa, Kocaeli, and Sakarya, the population based on the contours created is high.

Figure 9: Distribution of "peaks" with relation the rail line buffers
Since the analysis and modeling undertaken by Kolars and Malin, 256 kilometers (160 miles) of railroads were constructed. Seventy-nine kilometers is around Bursa, the fifth most populated province in Turkey and based on the DCW data, it does not connect to any other province center. Van and Agri, two provinces in the east experienced the development of railroads during the last 3 decades as well, mainly connecting to the Iranian border. Among these three routes in the region, only one of them around Agri, corresponding to 54 kilometers, was a planned railroad. The only line proposed by Kolars and Malin was the one connecting Bursa to other centers as Canakkale and Kocaeli, and forming a loop in the Thrace and Istanbul region in their analysis.
The approach taken in this study differs from Kolars and Malin in that, after seeing the peaks are already either on or within the 10 mile buffer of the existing network, the plateaus were examined. However, overlaying the topographical terrain layer (see figure 10), it was recorded that the province centers in the East Black Sea region as well as few others throughout the country could not be connected to the existing rail network physically.
Examining the remaining cities, including some of the middle population pressure province centers within a topographical context showed that if approximately 750 kilometers (470 miles) of railroad are constructed, 12 more province centers could be on the rail system (see figure 10). The criteria in calculating these distances were traveling on flat surfaces or the minimization of the slope and the shortest distance connection to a rail line in the case that the line would not have to cross any 1,000 feet contours. Instead of the redundant closed network simulation provided by Kolars and Malin, the calculations are based on connection to the rail system via one route.

Figure 10: Topography and province centers proposed to be connected to the existing rail network
These 12 province centers comprise a total of 4.8 million people and 1.2 million people in their centers. Among them, three of them are to the west of Ankara, and the remaining 9 provinces to the east of Ankara accommodate 3.7 million total population and around a million in their centers. Two hundred and forty of the 750 total kilometers are to connect the western centers, with Canakkale’s need being 150 kilometers. In the eastern regions, Corum’s connection would require 135 kilometers of rail construction in the expense of connecting around 150 thousand people in the center and 600 thousand people in the total province. Besides Corum, no other province center requires more than 63 kilometers of new rail line to be connected to the system.
CONCLUSIONS AND RECOMMENDATIONS FOR FURTHER STUDY
The utilization of Geographic Information Systems has made an analysis of rail network in Turkey much easier than the models generated few decades ago. In addition, initial calculation of possible rail expansions was done overlaying the major barriers from Kolars and Malin study and contour lines from Digital Chart of the World.
In further analysis, if available, utilization of population figures for the County seats, as were used in the previous study might be quite interesting. In various cases, connection of highly populated towns or counties that are located very close to rail lines could be much more cost-effective.
Combine with other analysis, these figures would be very useful to the Turkish government in their future efforts in transportation as well as regional development. Regional development efforts and policies in any developing country should not underestimate the importance of transportation networks and spatial interaction. To this end, spatial analysis employing GIS is critical.
Acknowledgements:
I would like to express my gratitude for Sandy Arlinghaus, Ph.D. and Prof. John Nystuen at the University of Michigan for inspiring me to undertake the study, for leading me to resources and for their review of my work and continuous feedback.
REFERENCE
Arlinghaus, Sandra L., Goodman Fredrick L., and Daniel Jacobs, 1997. Buffers and Duality, Solstice: An Electronic Journal of Geography and Mathematics, 8(2), Institute of Mathematical Geography, Ann Arbor, Michigan. http://www.imagenet.org
Digital Chart of the World, 1993. Database and Data Dictionary, Strategic Mapping Incorporated.
Hoyle B. S. and R. D. Knowles (eds.), 1992. Modern Transport Geography, London: Belhaven Press.
http://www.die.gov.tr, Web site for the State Statistical Institute of Turkey. January - April 1999.
Jefferson, Mark, 1928. The Civilizing Rails, Economic Geography, 4(3): 217-31.
Kolars, John and Henry J. Malin, 1970. Population and Accessibility: An Analysis of Turkish Railroads, The Geographical Review, 60: 229-246.
Lowe, John C. and S Moryadas, 1975. The Geography of Movement, Boston: Houghton Mifflin Co.
Taaffe, Edward J., Gauthier Howard L., and Morton E. O’Kelly, 1996. Geography of Transportation, New Jersey: Prentice Hall.
Taaffe, Edward J., Gauthier Howard L., and Morton E. O’Kelly, 1963. Transport Expansion in Underdeveloped Countries: A Comparative Analysis, The Geographical Review, 53: 503-29.
Tolley, R. S. and B. J. Turton, 1995. Transport Systems, Policy and Planning – A Geographical Approach, England: Longman Scientific and Technical.