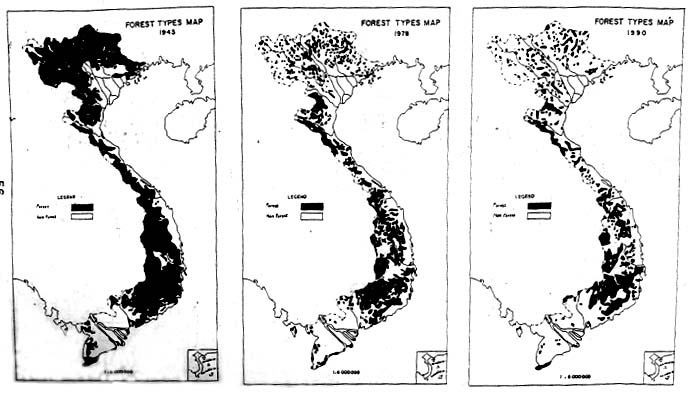
Image 1: 1943
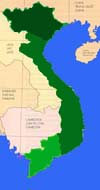
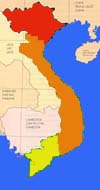
Image 2: 1978
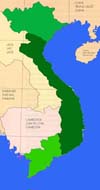
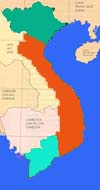
Image 3: 1990
Source: Forest Planning Institute of Viet Nam, Ha Noi (1990)
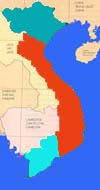
Deforestation by Surface Area (Movie-gear)
This map is an animated version of the map above. The timing between frame 1 and frame 2 as well as frame 2 and frame 3 is proportional to the number of years which have elapsed between maps (35 years and 12 years respectively). The timing between frame 3 and frame 1 is set slightly longer in order to more clearly see the loss of forest cover.

Years:
1= 1943
2= 1975
3= 1983
4= 1990
This map is colored according to the data above. Differences in tone were calculated and then mixed in Photoshop.
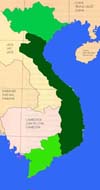
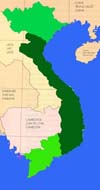
Red= 50%, Orange= 40%, Yellow= 30%, Green= 20%, Blue= 10%
