In my last presentation I had just received some usable dataGIS shapefiles and relevant census information for the country of South Korea and was in the middle of translating and figuring out what I could do with my data.
My research questions were as follows:
First of all, there were some major limitations of which 2 were most prominent:
1) The Census Data are Inconsistent:
2) Environmental Data Very Limited:
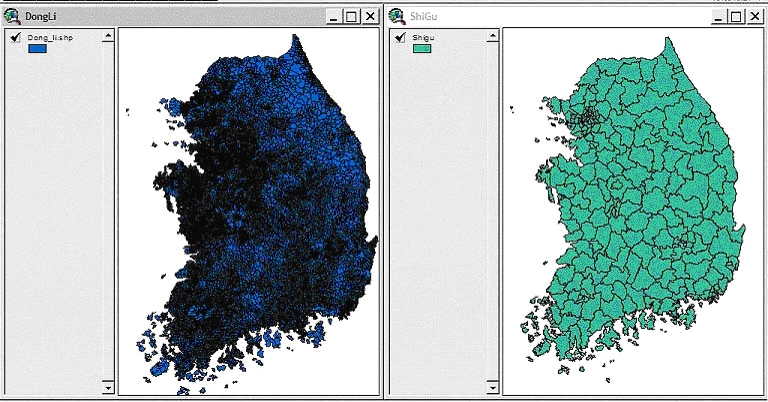
Once I had finished the grueling work of translating
everything into english, coding and joining all of my data, I found my
results to be rather disappointing.
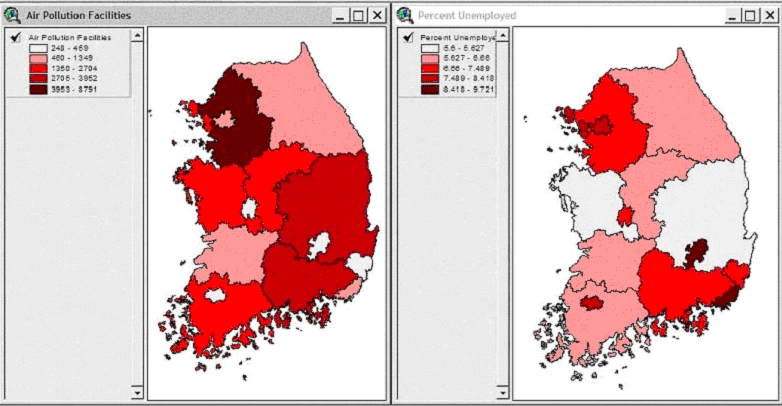
With the data I had available to me, the only remotely
interesting maps I was able to generate was by using the sketcy environmental
data on
"Number of Pollution Facilities (air, water pollution)"
and "Amount of Waste Generation (kg)." I also tried to include aspects
of those unemployed and the foreign population in my maps. Even though
the foreign popluation is an incredibly small minority in South Korea,
I was still interested to see whether these folks were predominantly concentrated
in one region or not.
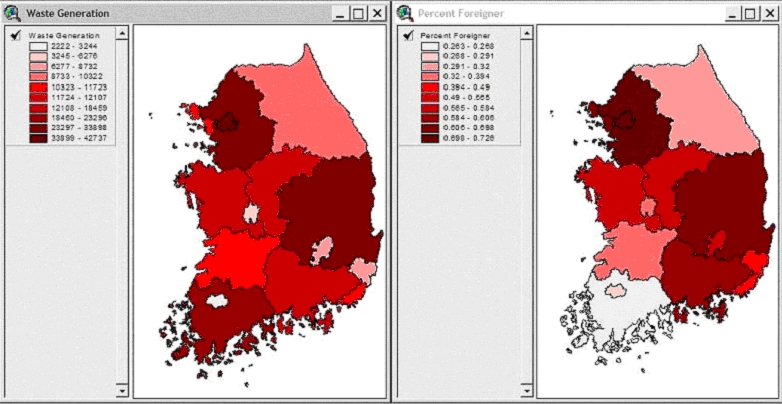
But really...none of these results are at all that interesting. One of the biggest issues is the fact that the region of study is just way too big to do any meaningful analysis. Although we can get some general ideas on what some of the general demographic characteristics are of a region (which probably can be compared to looking at population and housing data at the State level in the United States), that's just about where it all ends.
So that's about it for my semester project...
on SOUTH KOREA. 
CLICK!!!!