-
STATIC AND DYNAMIC MAPS: Maps on the computer--an application
of mathematics in geography--maps that are static images are available
in numerous locations on the internet; dynamic maps are available in limited
locations on the internet. Dynamic maps can be made using GIS software.
It is important to understand the difference between static and dynamic
maps.
-
STATIC MAPS: maps on the World Wide Web and elsewhere.
Click
here
for sample. More on this topic will come below.
-
DYNAMIC MAPS (maps that change when there is a change in the underlying
database). Geographical Information Systems (GIS). Two desktop
GISs: compare and contrast them. Generally, Atlas is based
more on classical cartography than is ArcView; however, ArcView makes much
greater use of the capability of the computer than does Atlas.
-
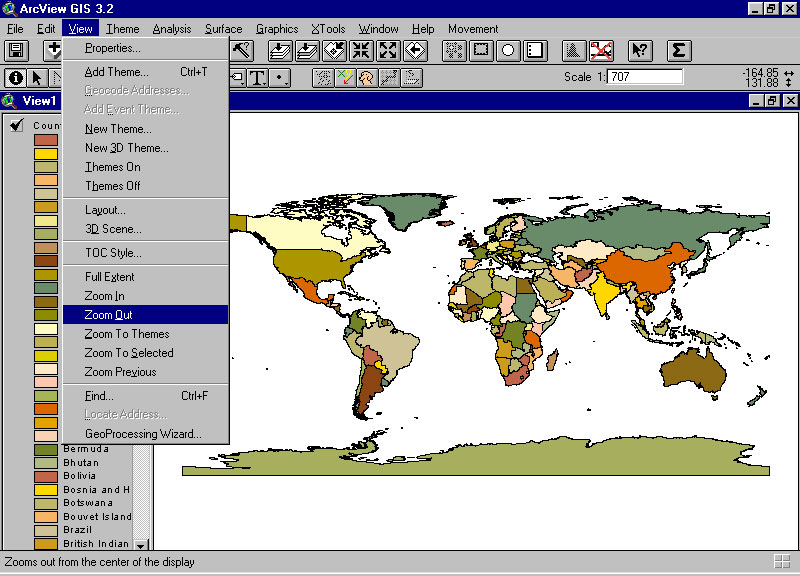
ArcView GIS (Environmental Systems Research Institute, ESRI)--open
a map of the world. Note the latitude and longitude read-out.
Default projection generally just a flat map.
-
Zoom-in tool: magnifying glass with a plus sign in it.
-
Zoom-out tool, magnifying glass with a minus sign in it, or use a menu.
-
Distance tool: distance from Chicago
to Cape of Good Hope to Sri Lanka; shows individual distance for last leg
of trip as well as accumulated distance, after the default flat map is
projected to some standard projection--here the Robinson.
-
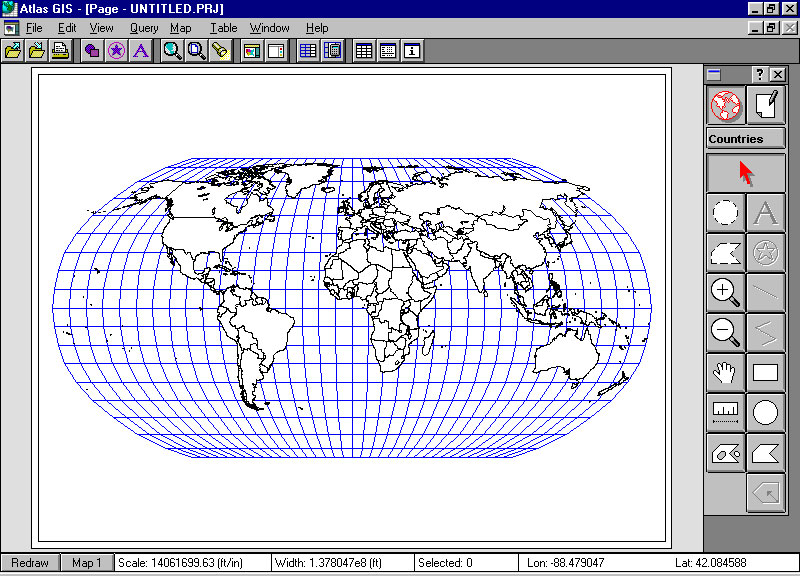
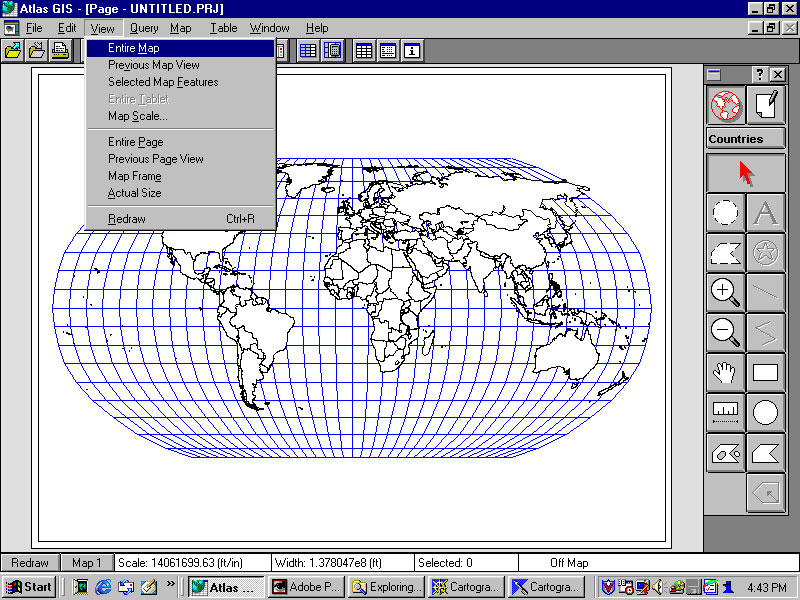
Atlas GIS (ESRI)--open a map of the world.
Note the latitude and longitude read-out. Default projection is a
Robinson projection.
-
Zoom-in tool: magnifying glass with a plus sign in it.
-
Zoom-out tool, magnifying glass with a minus sign in it, or use a menu.
-
Distance tool: distance from Chicago
to Cape of Good Hope to Sri Lanka; shows individual distance for last leg
of trip as well as accumulated distance. (Distance used is great
circle distance.)
-
Concepts:
-
Map scale
-
Latitude and longitude
(related reading: The Longitude; Mapping).
-
Map projection: Stereographic projection.
The One-point Compactification Theorem (blackboard
demonstration):
shows that the skin of a spherical globe cannot
be perfectly flattened into the plane; it fails to do so by at least one
point. Thus, there can be no perfect map in the plane.
-
Map projection as a transformation: Thompson's
fish
-
Links to various projections.
-
Geosystems Handouts on
Map Projections
-
Classification--move the center of projection; alter
the plane of capture (roll it up into a cylinder, torus, Möbius
strip, or Klein bottle--developable surface; try a cone).
-
Cylindrical and conical projections--choose a projection
suited to need.
-
Mercator--conformal--well-suited as a navigation
chart. Equal area projection better-suited to showing map of the
world.
-
Making GIS maps using onboard information and base maps--demonstration
of thematic mapping. Different methods of partitioning the data can
lead to very different maps. When considering a thematic map made
by someone else, it is therefore important to consider how the underlying
database might have been partitioned.
-
Quantiles--there are roughly the same number of observations in each interval
but the size of the interval might vary.
-
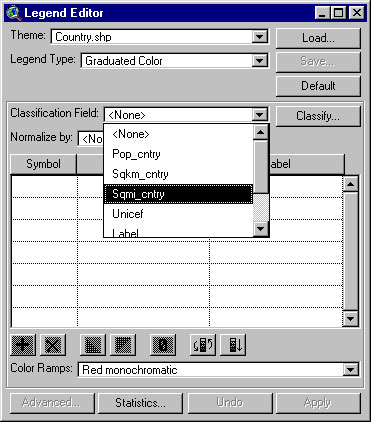
With a map of the world in view, double click on the "legend" on the left
(in ArcView). A "legend editor" pops
up. Choose "graduated color" from the pull-down menu. The default
value colors each country a unique color (called "unique value").
Choosing "graduated color" will enable you to group countries with similar
characteristics as one color. The map will have a theme, such as
the world's lands grouped by area. Data about area will be grouped
into ranges, or categories, by color (e.g. all countries of less that 1.6
million square miles are colored pink).
-
You will need to choose a classification field; that is, you will need
to choose some set of data. For example, choose "sqmi_cntry"
or number of square miles in each country shown on the map.
-
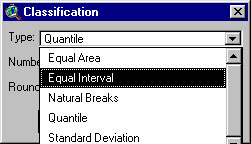
Choose the classification method for the data. That is, how is the
information about area to be split into different categories? One
way is to choose by "quantile."
-
Notice now that back in the legend editor you can choose various color
schemes; the default scheme is red monochromatic
(different shades of red come up for different data ranges--pink for lower
values, deep red for higher values).
-
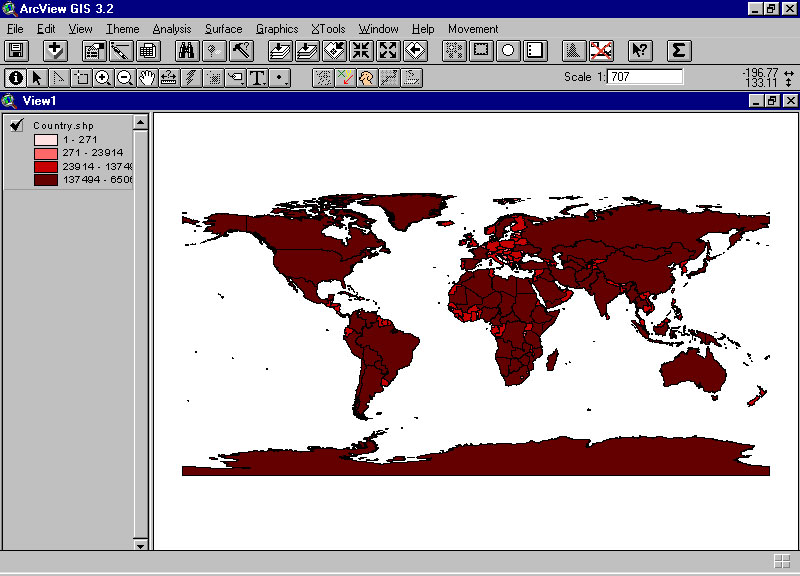
Now, look at the map made using this process.
There are many countries in the deep red category that are visible on the
map and none that are easily visible in the pink range. This observation
should not be surprising, but it should be noted.
-
Equal interval--the size of the interval is uniform but the number of observations
within each interval might vary.
-
Repeat the steps above, but instead of choosing "quantile" as the method
by which to partition data, choose instead "equal
interval."
-
Look at the result back in the legend editor;
keep the color scheme the same (red monochromatic).
-
Now, look at the map made using this process.
Compare and contrast the result with the map above. Notice
the importance of selecting a method for partitioning of data and its implication
for resulting maps. (Related reference: Monmonier,
How to Lie with Maps.)
-
Other methods of data partitioning and consequences for associated maps
are available, as well, in most GIS packages. Each has its own merits
and drawbacks; each produces maps different from other data partitioning
methods.
-
Concepts:
-
Partition--choose method according to data arrangement.
-
Jordan Curve Theorem; implications for mapping.
The Jordan Curve Theorem:
-
permits correct assignment of addresses on either
side of streets
-
permits visually appropriate coloring of polygons
-
illustrates the need to split complex curves apart
at nodes where the curve crosses itself in order to ensure that the two
properties above will hold on maps. This fact is important in digitizing
(and elsewhere).
-
Coloring--no more than four colors are ever required
to color a map in the plane.
The Four Color Theorem:
-
shows that four colors are enough to color any map
in the plane with adjacency of regions defined across an edge only. Defining
adjacency in other ways is a topic of current research.
-
suggests that if distinctions need to be made that
correspond to gradations in data, that a graded scale of four colors will
always be enough to color a map in the plane. More than four colors may
be useful in making a graded gray-scale or variations in intensity of color
that reflect intensity in data sets.
-
Other surfaces may require different numbers of colors--consider
the sphere (use stereographic projection).
-
PORTABLE DOCUMENT FILES AND STATIC MAPS
-
Maps on the CD from this series
-
GIS maps made in ArcView 3.2 from the data available on accompanying CDs
-
a FEW links are listed below as entries to the vast array of mapping sites
that are out there. Click directly on the link or read off the URL
from the link.
Alexandria
Digital Library
American Geographical Society
American Mathematical
Society
Association of American Geographers
Astronomy
and Astrophysics (WWW Virtual Library)
Bodleian
Library Map Room
Bosnian
Virtual Fieldtrip
Canadian
Cartographic Exhibit
Cartographic
Materials Home Page: Canada
Cartography
and Geographical Sciences
CIESIN: Consortium
for International Earth Science Information Network
City of Ann Arbor
Cleveland Clinic
Foundation
Community Systems Foundation
CTI Geography,
Geology, and Meteorology
Departments
related to geography
Earth/Geoscience
Information
Earth
Sciences and Map Library at Berkeley
Earth
Sciences Index
Earth
Viewer
ESRI Home Page
Fabulous Ruins of Detroit
Federal Geographic
Data Committee Internet site
Galaxy
Einet
Generic
Mapping Tools
Geological
Society of America
Geography Network
Geography
of Virginia; George Mason University and Prince William Institute
GIS
Literature Database, University of Maine
GIS
Seminar Series, The University of Michigan
Great
Lakes Map Server
Historic
Maps of Dutch Cartographers
How Far
Is It?
Hubble Space Telescope
Hunter
College, Terrain Analysis Home Page
ICC
97, Stockholm, Sweden, Maps and Mapping in the Information Society
Institut
für angewandte Geodäsie Potsdam, Abt. Kartographie
Institute
of Mathematical Geography
International Society of
Spatial Sciences
James
Ford Bell Library at the University of Minnesota
Mapmaker,
Mapmaker, Make Me a Map
Mapquest,
GeoSystems Global Corp.
Maps
of Paris
Microcomputer
Specialty Group, Association of American Geographers
National
Atlas Information Service, Canada
National Center for Geographic
Information & Analysis, SUNY Buffalo
National Center for Geographic
Information & Analysis, University of California at Santa Barbara
National Center for Geographic
Information & Analysis, University of Maine
National
Geographic Society
National Imagery
and Mapping Agency
National Oceanic
and Atmospheric Administration
National Spatial
Data Infrastructure
NCGIA core curriculum
NCGIA Home
Page
New
York State Maps: Cartographic Images Created Prior to 1830
Newberry Library
The North
Carolina Center for Geographic Information and Analysis
Numerical
Cartography Laboratory, The Ohio State Universtiy
Oliver
Weatherbee's GIS and GIP Software Listing
Pennsylvania State University,
MapRoom, Digital Chart of the World
The
Perseus Atlas Project
Rand
McNally
The
Ranges of North American Breeding Birds
Regional
Science Association, International
Ryhiner
Map Collection, Berne, Switzerland.
South East Michigan Council on Government
Spatial
Odyssey, NCGIA, University of Maine
Subway
Navigator
Surf Your Watershed,
EPA
Thünen
Society
United States
Geological Survey
University of Chicago,
Regenstein Library, Map Collection
University
of Chicago, Oriental Institute Maps
University
of Connecticut Library
University
of Connecticut Magic
University
of Iowa, Center for Global and Regional Environmental Research---Maps and
References
University of
Illinois
University
of Michigan Map Library
University of Minnesota
University of
Wisconsin, Madison
University of Wisconsin,
Milwaukee
U.S.
Census Bureau data Access Tools
U.S.
Gazetteer
USGS
Circular c1000
USGS National
Mapping Information
The
Virtual Geomorphology
The
Web Window to the Invisible Universe
World of
Maps
Xerox
Parc Map Viewer
Yahoo Science
Planetary Pictures...
http://www.jpl.nasa.gov
http://mpfwww.jpl.nasa.gov
http://mgs-www.jpl.nasa.gov
http://www.msss.com/mars/pictures/viking_lander/viking_lander.html
http://mars.compuserve.com/default.html
http://www-mgcm.arc.nasa.gov/mgcm/research.html
|