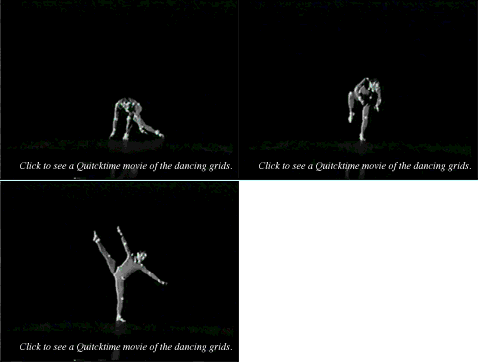
The Dancing Grids
The grid patterns on the large video screens behind the performers originated in Fred Bookstein's researches in morphometrics, the measurement of biological shape and shape change. They act as a simplified representation of each dance, translated into a different medium. The grids began as diagrams of changing features of the human brain. Designed by Bill Green at the Institute of Gerontology, the Edgewarp computer mapping program places landmark points of human brains onto a grid to depict and measure differences between normal and abnormal groups. For example, the difference between the brains of healthy children and the brains of children affected by fetal alcohol syndrome warps the grid to produce a visual image of the consistent effect of the syndrome. This difference appears to us as dynamic change in a three-dimensional surface. Bookstein's research shows that we can understand shape differences between brains better this way than we were to compare tables of average measurements. His graphical method has considerable promise in studies of craniofacial surgery, normal and abnormal growth, and the development of brain diseases such as Alzheimer's.
 Bookstein had been asked by Cogswell to contribute some of his brain images to the
Enigmas Project, as they emphasized the themes of human exploration in both inner and
outer space. As the project developed, the contributors realized that they could use the
grids of the Edgewarp program to complement the dances not only conceptually but also
geometrically -- like differing brains, they represent deformations and changes of biological
forms. With the assistance of Bill Green, the contributors adapted the Edgewarp
technology to the dances. First, Sparling compacted the choreography of his solos into
their essential movements, distilling about forty minutes of dance into a dive-minute series
of motions. In order to create a "normal," neutral position from which to map the changes
in his body caused by the dances, the collaborators used the pose of Leonardo Da Vinci's
famous "Vitruvian Man," a male body with arms and legs stretched outwards, the whole
spread into a flat plane. Pieces of reflective tape marked twenty-one key landmarks of
Peter's body (forehead, shoulder, elbows, wrists, hips, and so on), and a square grid was
tacked to this figure with corners near the original hands and feet. Beginning with the
Vitruvian pose, Sparling then performed the key gestures of the Enigmas in front of Bob
Andersen's video camera. At every sixtieth frame of the videotape, Cogswell relocated the
landmarks on the image of Sparling's body position. These new landmarks deformed the
original grid, following the pattern of the dance. Using conventional animation techniques,
Bookstein finally turned the sequence of deformations of the grid into the smooth motion
that was seen on the screen.
Although these grids, like the video images on which they were originally mapped, are two-dimensional, we cannot help but perceive the shape changes as three-dimensional. Our eyes "read" the shifting two-dimensional grid as changes in a three-dimensional form that began as the frontal plane of Peter Sparling's figure. These grids enhance our awareness of the changes in the three-dimensional space immediately around the dancers. In the end, each dancer moves alongside a beautifully simplified representation of his or her dance, translated into a different medium. In Yeats's phrase, we now "tell the dancer from the dance."
History of the Project
The Hubble Spacecraft Telescope Images
Introduction
Enter the Exhibit