Chapter 13: Unsteady State Nonisothermal Reactor Design
The ARSST: Testing for Runaway Reaction Temperatures
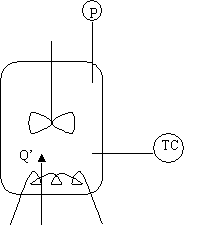
The Advanced Reactive System Screening Tool (ARSST) is a batch reaction used to identify potential safety hazards. It consists of a well instrumented batch reaction that is heated in such a manor so as to raise the temperature at a uniform rate. It is primarily used for liquid phase reactions.
For more information, visit www.ARSST.com
\( A + B \rightarrow C \)
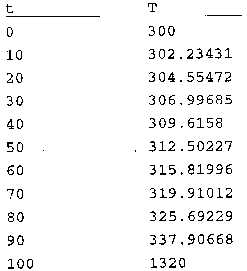
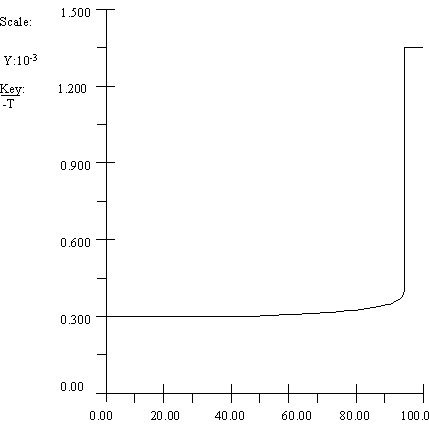
A batch reactor is heated by an external heater at a rate of 0.2 C/min. Plot T vs. t and find the ignition temperature.
Solution
| For |
\( \Delta \hat{C}_P = 0 \) |
|
|
\( \frac{dT}{dt} = \frac{Q + (r_A V)(\Delta H_{RX})}{N_A C_{P_A} + N_B C_{P_B} + N_C C_{P_C}} \) \( = \frac{Q}{N_A C_{P_A} + N_B C_{P_B} + N_C C_{P_C}} + \frac{(r_A V)(\Delta H_{RX})}{N_A C_{P_A} + N_B C_{P_B} + N_C C_{P_C}} \) |
||
| dividing by V, | ||
|
\( \frac{dT}{dt} = \dot{Q}' + \frac{(r_A V)(\Delta H_{RX})}{C_A C_{P_A} + C_B C_{P_B} + C_C C_{P_C}} \) |
||
|
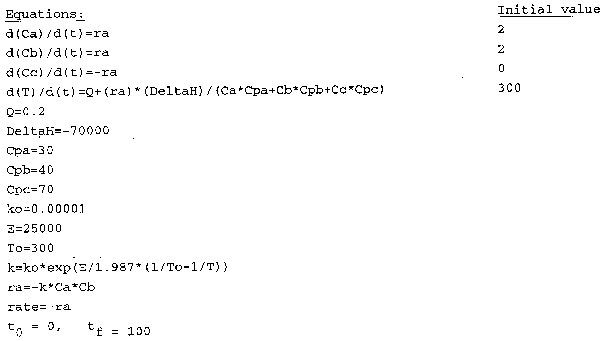
\( r_A = -k C_A C_B \) \( k = k_0 \exp \left[ \frac{E}{R} \left( \frac{1}{T_0} - \frac{1}{T} \right) \right] \) \( \frac{dC_A}{dt} = r_A \) \( \frac{dC_B}{dt} = r_B = r_A \) \( \frac{dC_C}{dt} = r_C = -r_A \) \( \dot{Q} = 0.2 \, \text{°C/min} \) \( k_0 = 0.00001 \, \text{dm}^3/\text{mol} \cdot \text{min} \) \( E = 25,000 \, \text{cal/mol} \) \( R = 1.987 \, \text{cal/mol} \cdot \text{K} \) \( T_0 = 300 \, \text{K} \) |
||
|
\( \Delta H_{\text{Rx}} = -70,000 \, \text{cal/mol} \)
\( C_P^A = 30 \, \text{cal/mol/K} \) \( C_P^B = 40 \, \text{cal/mol/K} \) \( C_P^C = 70 \, \text{cal/mol/K} \) \( C_{A0} - C_{B0} = 2 \) \( T_0 = 300 \) |
||
| Using Polymath to Solve: | ||
|
||
|
||
|
||
| The ignition temperature is approximately 338K. | ||