Chapter 13: Unsteady State Nonisothermal Reactor Design
Questions related to Problem 13-2
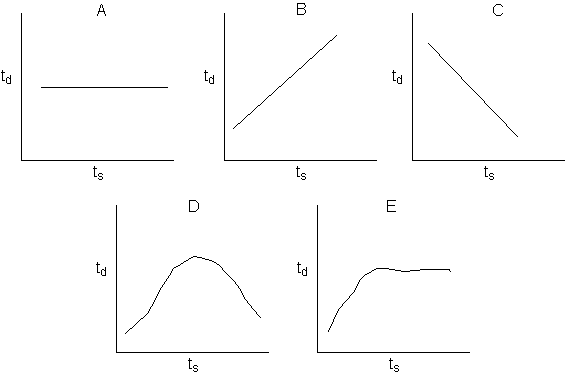
1. Let’s revisit the explosion in Example 13-2. Suppose that the heating had not failed 55 minutes after startup, but instead at 1 hour and 55 minutes, would the reactor have exploded for a down time of 10 minutes? What if the reactor only had a down time of 5 minutes 30 minutes after start up, would the reactor have exploded? Which of the following figures relates the down tine, td, to time after startup that the heat exchanger failed, ts, for which the reactor would not explode?
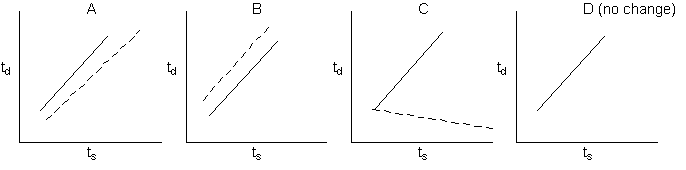
2. Suppose inerts are added
to the system in Example 13-2. The dashed line represents the relationship
after the inerts were added. Which figure represents how the relationship
between ts and td would change? The solid line represents
the case without inerts?
SOLUTION
1) The answer is B.
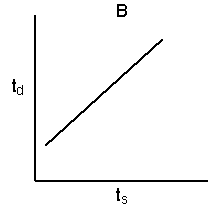
After longer times, ts, the rate will be slower because reactant will have been consumed. Therefore, longer down times will be possible.
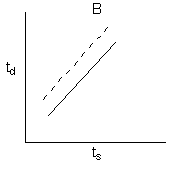
2) The answer is B. (solid line represents case without inerts)
\( \frac{dT}{dt} = Q_g - Q_r = \frac{Q_g - Q_r}{\sum N_i C_{P_i}} = \frac{Q_g - Q_r}{N_A C_{P_A} + N_B C_{P_B} + N_C C_{P_C} + N_I C_{P_I}} \)
We see the rate of temperature increase, dT/dt, decreases as the amount of inert, NI increases. Therefore, the temperature will not rise as rapidly during the adiabatic period (down time, td) and we can have longer down times without having an explosion.