


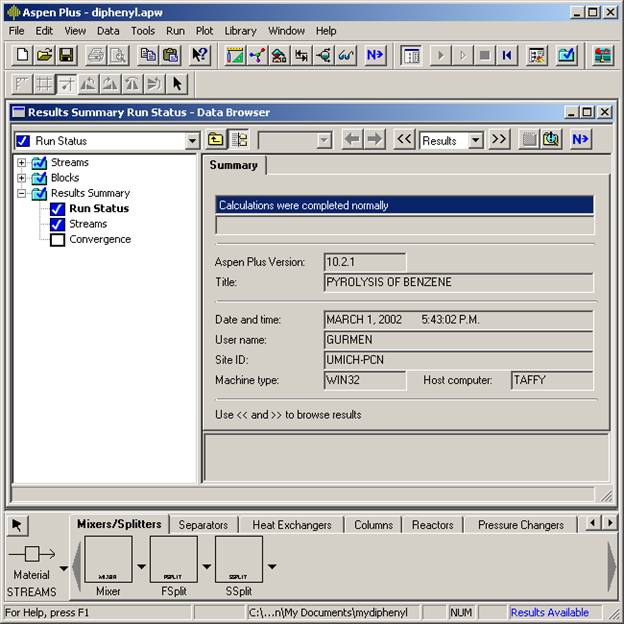
The results summary is shown by default. The first page is the run status screen.
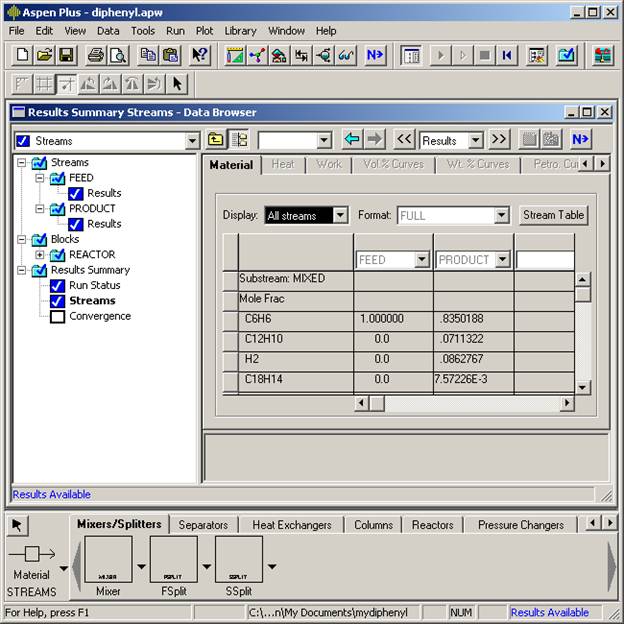
The streams screen gives the results for all streams. You can compare the mole fractions to the one reported in the original problem specification.
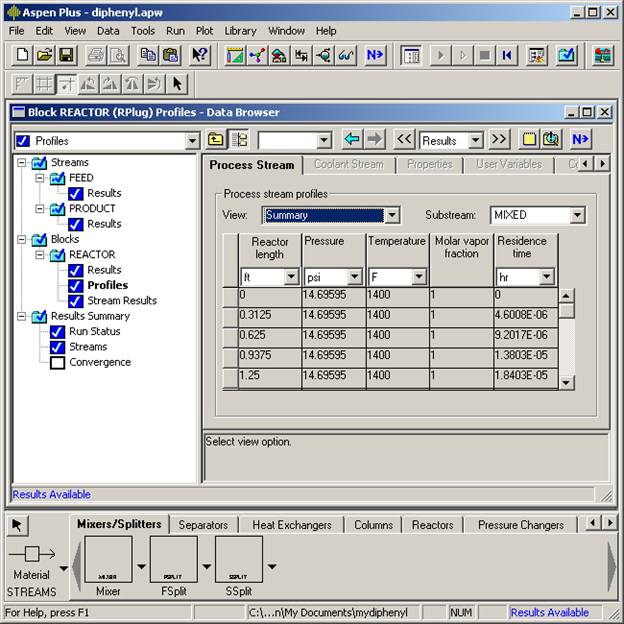
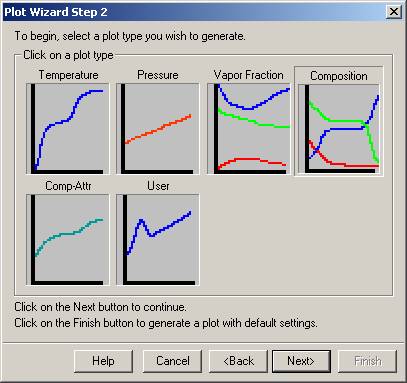
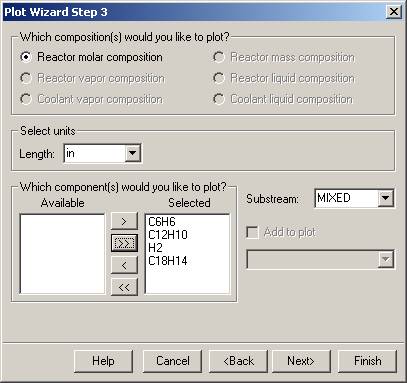
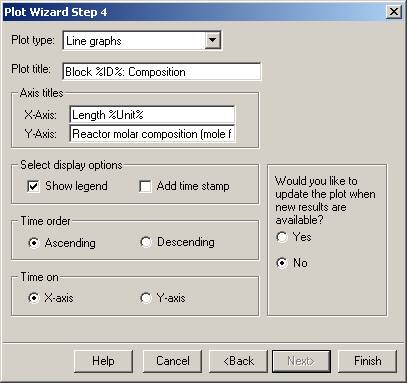
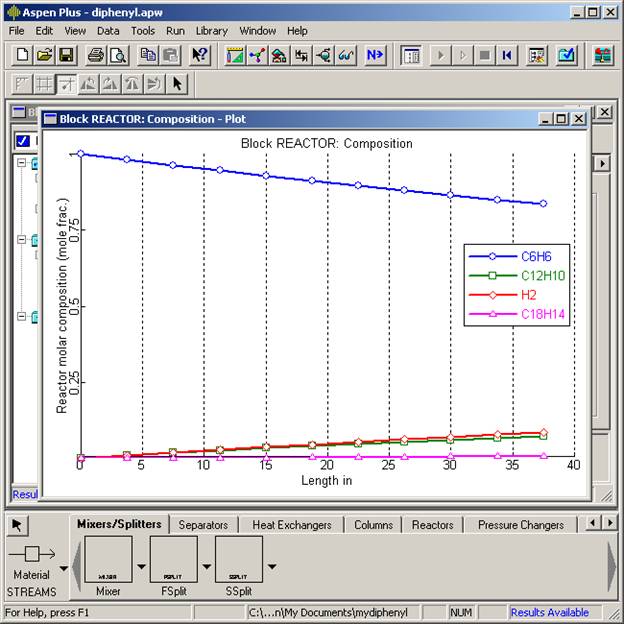
The profiles screen is where you will find concentration, temperature, etc. profiles along the reactor. These results can be analyzed by the Plot Wizard entry from the Plot menu.
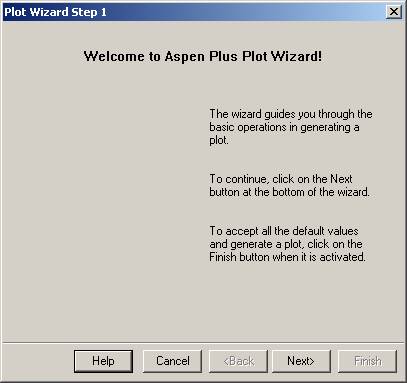
To plot the molar concentration profiles follow the steps outlined in the next three pages.
This concludes our introductory tutorial on Aspen Plus™.