Chapter 3: Rate Laws
Excercise for Molecular Simulation 2
When you access the website, you should see something very similar to this:
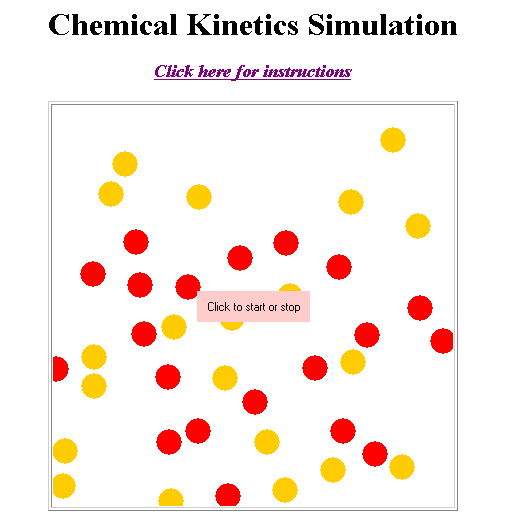
The reaction is
Red + Yellow ↔ Green + Blue
Look at the box in the upper left-hand corner of the screen. The numbers in the boxes next to red/yellow/green/blue are initial number of molecules (i.e. initial concentration or number density). The probabilities of reaction for a collision between reactants are called the reaction rate constants and are given as "k_f" for the forward reaction and "k_r" for the reverse reaction.
If kf = krand the number of red balls equals the number of yellow balls, then at long times there should be 50% reactants and 50% products.
(a) Click on stripchart ON. How does the time to reach equilibrium change when you increase the number of red and yellow balls?
(b) How does the time to reach equilibrium change when you increase kf and kr?
(c) Once equilibrium is reached are there any reactions taking place?
(d) What happens when kf ≠ kr?
(e) Describe what happens when the number of red balls does not equal the number of yellow balls initially?
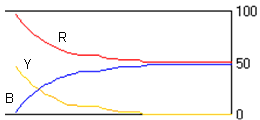
(f) Estimate the initial concentrations and the reaction rate constants for the following figure and explain the reason of the plateau in the figure.
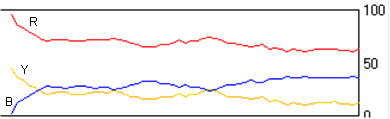
(g) Estimate the initial concentrations and the reaction rate constants for the following figure and explain the reason of the plateau in the figure.
(h) Are the reactions still going on once equilibrium is reached?
(a) Set the kinetics (1↔1)
Describe what you find when you vary the temperature.
Repeat (a). Describe what you find when you set F Rate = B Rate.
(b) Set (2↔2) kinetics (e.g. A + B → C + D).
Red + Blue → Yellow + Green
Set Red = 50, Blue = 50 and Yellow=Green=0. Vary the temperature and describe what you find.
Set B Rate = 0.0025 and describe what you find as you vary the temperature.