|


Kim Firestone built the MCD table - Thanks, Kim!
|
Magnetic Circular Dichroism (MCD)
Both CD and MCD spectroscopies measure the difference in intensity between left and right
circular polarized light. However, in contrast to CD, MCD spectroscopy is performed in a strong
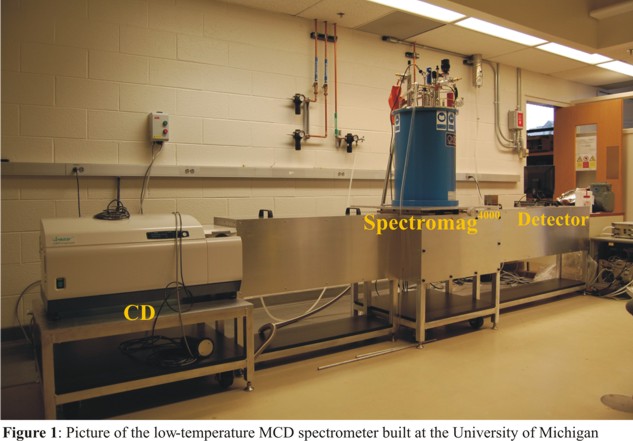
magnetic field parallel to the direction of propagation of the circular polarized light. Figure 1 shows
the setup of the MCD spectrometer that we have built at the University of Kiel, Germany. The MCD spectrometer
consists of a JASCO J-810 CD spectropolarimeter, a Spectromag4000 cryostat (OXFORD) with incorporated
superconducting magnet, and the detector as indicated in Figure 1. The complete MCD spectrometer built
in Kiel is 4.7 m long and 70 cm wide. The frame is manufactured from square type stainless steel tubes
(30 x 30 x 2 cm) and aluminum plates.

Typical experimental conditions for LT MCD measurements are temperatures between 1.5 - 30 K (liquid helium)
and magnetic fields of 0 - 7 T. The Spectromag4000 cryostat comprises a horizontal field split pair
superconducting magnet in a low boil-off helium cryostat. The magnet is also able to operate at 8 T, but this
requires cooling of the magnet coil to 2.2 K. For the 2.2 K operation of the magnet, a lambda point refrigerator
is included in the Spectromag4000 system. Samples are loaded into a 1.5 - 300 K variable temperature insert (VTI),
which offers access to the sample by four optical windows in the tail piece of the cryostat made from Spectrosil B
quartz. Two of these windows are oriented parallel to the field, two are perpendicular (cf. Figure 4.3). The inner
liquid helium bath (20 L volume) is surrounded by a liquid nitrogen bath (24 L volume) and a vacuum jacket, which
is designated as the outer vacuum chamber (OVC; 41 L volume). Both baths are fitted with a liquid level probe.
The VTI and the helium bath are connected via an automatic needle valve. The helium flows via the needle valve
from the main reservoir into the VTI. The sample is located at the bottom of the VTI and this way, directly cooled
by the helium stream. The needle valve is fitted with a heater to allow blockades to be cleared without the necessity
to warm up the entire system. The circular polarized light is generated by a JASCO J-810 CD spectropolarimeter
(cf. Figure 1). The light source is a 150 W air cooled xenon lamp and the detector system corresponds to two
interchangeable head-on photomultiplier tubes with a combined wavelength range of 163-1100 nm.

MCD Theory
MCD spectroscopy measures the difference between the intensity of left and right circular polarized light.
For right circular polarized (rcp) light the selection rule is Dm = -1, whereas for left circular polarized
(lcp) light
it is Dm = +1. The total MCD intensity can be written as [1]-[2]:

From this equation the MCD intensity is proportional to three different contributions, designated as MCD A-, B- and C-terms.
The function f(E) represents the band shape of an absorption band. Hence, B- and C-terms both show an absorption band shape
in MCD, whereas the A-term corresponds to a signal with a derivative band shape. Importantly, the A- and B-terms are
temperature independent, whereas MCD C-term intensity is temperature dependent. Figure 3 illustrates the different origins
of the A-, B- and C-term mechanisms.

In order for A-term intensity to arise, the molecule must have degenerate excited states as shown in Figure 3a. In the
presence of a magnetic field the excited state is split due to the Zeeman effect. Since the Zeeman splitting is usually
only of a few wavenumbers, the oppositely signed transitions for rcp and lcp light will almost cancel leading to a
derivative band shape (cf. Figure 3a). Figure 3b shows the origin of B-term MCD intensity. In this case, magnetic field
induced mixing of the excited state |J> with an energetically close intermediate state |K> occurs. Alternatively,
field-induced mixing is also possible between the ground state |A> and an intermediate state |K>. However, in both cases
significant B-term intensity does only arise if |K> is close in energy to either the excited state |J> or the ground
state |A>. On the other hand, in the second case it is required that the energetic separation between |A> and |K> is
large enough such that |K> is not thermally populated. Otherwise, this leads to C-term intensity. As already stated,
B-term signals have an absorption band shape. Finally, the most important mechanism at low temperatures is the C-term [4]-[6].
C-term intensity arises from a degenerate ground state, which is split in the magnetic field due to the Zeeman effect.
In general, degenerate ground states are due to spin degeneracy and hence, only paramagnetic compounds exhibit C-term
signals. Thus, A- and C-term MCD intensity requires either a degenerate excited state or a degenerate ground state.
At low temperatures, kT is in the order of the Zeeman splitting in the presence of a strong magnetic field, which leads
to a larger population of the lower-energy compared to the higher-energy Zeeman sublevels of the ground state corresponding
to the Boltzmann distribution. Hence, the intensities of the rcp and lcp transitions to not cancel anymore leading to an
absorption band shape for the C-term as shown in Figure 3c. A further decrease of the temperature or an increase of the
magnetic field results in a further increase in the population of the lowest-energy sublevel and therefore, the C-term MCD
intensity also increases. If the higher-energy sublevels are completely depopulated, the C-term intensity reaches its
maximum value (saturation limit). Importantly, the temperature and magnetic field dependent C-term intensity contains
the complete information of the properties of the ground state including g values and zero-field splitting parameters
as well as the polarization of the electronic transitions. Experimentally, the C-term spectrum can be calculated from
MCD raw data by substraction of MCD spectra measured at different temperatures but the same applied magnetic field.
A- and B-terms can be distinguished via their different band shapes.
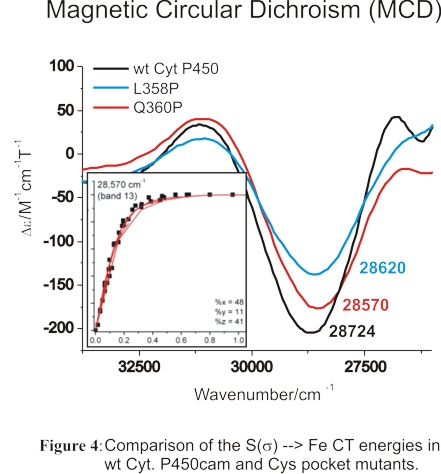
We have also studied the high-spin ferric heme active site of wild-type (wt) Cyt. P450cam and corresponding variants
where the number of hydrogen bonds to the proximal Cys (the 'Cys' pocket) has been altered in order to determine whether
significant changes to the Fe-S bond could be induced in this way. For this purpose, we used MCD and rR spectroscopy to
investigate the properties of the Fe-S bond in ferric wt Cyt. P450cam and two Cys pocket mutants. Using MCD spectroscopy,
we identified the S -> Fe(III) charge transfer (CT) transition in these proteins, and compared the energies of this feature
in the different Cyt. P450cam variants as shown in Figure 4. Our results show that these hydrogen bonds only have a very small
effect on the Fe-S bond in ferric Cyt. P450cam. Hence, the role of the Cys pocket lies less in fine-tuning of the Fe-S bond
strength, but mostly in stabilizing the thiolate donor to prevent protonation (or reaction with diatomics), and hence, P420 formation,
as well as in positioning the sulfur atom relative to heme.88 These results have important, general implications for Cyt. P450
catalysis: the weak H-bonds, leading to strong Fe-S interactions, are in fact advantageous for the catalytic role of Cys357
in the formation of Compound I via the "push" effect. Hence, application of weak H-bonds constitutes the best compromise between
stabilization/positioning of the proximal Cys and strong S -> Fe donation advantageous for Cyt. P450 catalysis. These studies
were performed in collaboration with Prof. David Ballou (Department of Biological Chemistry, University of Michigan).

Similar studies were recently initiated on Nitric Oxide Synthase (NOS) in collaboration with
Prof. Jim Feng (University of New Mexico). First results were recently published.
References:
F. Paulat, N. Lehnert
"Detailed Assignment of the Magnetic Circular Dichroism and UV-Vis Spectra of
Five-Coordinate High-Spin Ferric [Fe(TPP)(Cl)]"
Inorg. Chem. 2008, 47, 4963-4976.
C. Hu, C. D. Sulok, F. Paulat, N. Lehnert, A. I. Zatsman, M. P. Hendrich, C. E. Schulz, W. R. Scheidt
"Just a Proton: Deprotonation of the proximal Imidazole changes the Ground State of High-Spin Iron(II) Porphyrinates"
J. Am. Chem. Soc. 2010, 132, 3737-3750.
M. G. I. Galinato, T. Spolitak, D. P. Ballou, N. Lehnert
"Elucidating the Role of the Hydrogen Bonding Network in Ferric Cytochrome P450cam and corresponding Mutants using
Magnetic Circular Dichroism Spectroscopy"
Biochemistry 2011, 50, 1053-1069.
N. Lehnert
"Elucidating Second Coordination Sphere Effects in Heme Proteins using Low-Temperature Magnetic Circular Dichroism
Spectroscopy"
J. Inorg. Biochem. 2012, 110, 83-93.
(invited contribution: JIB Early Career Focused Review; selected for Journal cover: Volume 110, May 2012)

J. Sempombe, M. G. I. Galinato, B. O. Elmore, W. Fan, J. G. Guillemette, N. Lehnert, M. L. Kirk, C. Feng
"Mutation in the FMN Domain Modulates MCD Spectra of the iNOS Ferric-Cyano Complex in a Substrate-Specific Manner"
Inorg. Chem. 2011, 50, 6859-6861.
A. B. McQuarters, A. L. Speelman, L. Chen, B. O. Elmore, W. Fan, C. Feng, N. Lehnert
"Exploring second coordination sphere effects in nitric oxide synthase"
J. Biol. Inorg. Chem.(JBIC) 2016, 21, 997-1008
M. W. Wolf, K. Rizzolo, S. J. Eliott, N. Lehnert
"Resonance Raman, Electron Paramagnetic resonance, and Magnetic Circular Dichroism Spectroscopic Investigation of Diheme
Cytochrome c Peroxidases from Nitrosomonas europaea and Shewanella oneidensis"
Biochemistry 2018, 57, 6416-6433
M. G. I. Galinato, E. P. Brocious, F. Paulat, S. Martin, J. Skodack, J. B. Harland, N. Lehnert
"Elucidating the Electronic Structure of High-Spin [MnIII(TPP)Cl] Using Magnetic Circular Dichroism Spectroscopy"
Inorg. Chem. 2020, 59, 2144-2162
Literature:
[1] Stephens, P. J. Ann. Rev. Phys. Chem. 1974, 25, 201-232.
[2] Stephens, P. J. Adv. Chem. Phys. 1975, 35, 197-264.
[3] Solomon, E. I.; Pavel, E. G.; Loeb, K. E.; Campochiaro, C. Coord. Chem. Rev. 1995, 144, 369-460.
[4] Neese, F.; Solomon, E. I. Inorg. Chem. 1999, 38, 1847-1865.
[5] Oganesyan, V. S.; George, S. J.; Cheesman, M. R.; Thomson, A. J. J. Chem. Phys. 1999, 110, 762-777.
[6] Lehnert, N.; DeBeer George, S.; Solomon, E. I. Curr. Opin. Chem. Biol. 2001, 5, 176-187.
|


