Validation of 4D-MSPECT for the Estimation of Left
Ventricular Ejection Fraction.
For this validation study, 89 patients underwent single plane
contrast ventriculography (CVG). Ventricular volumes and ejection
fraction (EF) were calculated by the methods of Dodge and Sandler (Circ
Res Supp. II, 1974).
Each of these patients also underwent gated (16 intervals) stress
myocardial perfusion tomographic imaging with Tc-99m-Sestamibi within
90 days of the contrast ventriculography study. Images were
reconstructed using filtered backprojection, spatially and temporally
filtered and re-sliced along the axis of the heart to provide
short-axis slices throughout the heart volume. The short-axis images
were then processed using 4D-MSPECT to measure ventricular chamber
volumes for each gating interval. The ejection fraction was calculated
from the volumes determined at end-diastole and end-systole.
A regression plot was made comparing the 4D-MSPECT ejection fraction
with the value obtained from contrast ventriculography. The high
correlation value (r=0.90) effectively validates 4D-MSPECT for the
calculation of LV ejection fractions over a broad physiologic range.

Figure 1. Correlation of estimated ejection fractions (EF) from
4D-MSPECT and contrast ventriculography (CVG).
The same cohort of patients were processed using Cedars Sinai QGS v4.0
for the Pegasys and the QGS estimated ejection fractions were compared
to the CVG ejection fraction determinations. The correlation between
QGS and CVG is shown in Figure 2. Although the y intercepts were almost
exactly the same for 4D-MSPECT and QGS, for 4D-MSPECT the slope of the
regression line more nearly approximated the line of identity and the r
value was considerably higher.

Figure 2. Correlation of estimated ejection fractions (EF) from QGS and
contrast ventriculography (CVG).
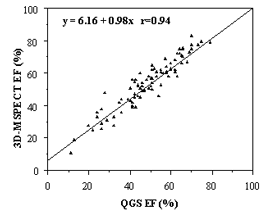
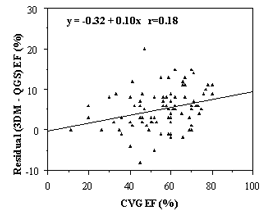
The correlation of EF values between 4D-MSPECT and QGS is shown in the
left plot of Figure 3. The EF values from the two programs are highly
correlated (r=0.94) with a slope approaching unity. The correlation
between the EF residual (4D-MSPECT - QGS) and the CVG EF is shown in
Figure 3 (right). The average difference between 4D-MSPECT and QGS was
9.3%. The residuals tended to increase with increasing ejection
fraction values (slope 0.10). This behavior of the residual EF values
compared to QGS has also been seen with the Emory Cardiac Toolbox.
Emory University conducted a study in which they compared EF
determinations from the Emory Cardiac Toolbox and QGS with EF values
from gated magnetic resonance imaging (J Nucl Med, May 1999). They
found a higher correlation of EF values from the Emory Cardiac Toolbox
with MRI than with QGS and a trend to higher EF values compared to QGS
in the high physiologic range (slope 0.08).
  Figure 3.
Left plot shows the correlation of estimated ejection fractions (EF)
from 4D-MSPECT and QGS. The right plot shows the 4D-MSPECT/QGS EF
residuals vs. contrast ventriculography (CVG) ejection fraction (EF).
|


