—
Gelman Chapter 12 examples
21 Sep 2020
Use for outputs
local gelman_output esttab,b(1) se wide mtitle("Coef.") scalars("rmse sigma") ///
    coef(_cons "Intercept" rmse "sigma") nonum noobs nostar var(15)
local gelman_output2 esttab,b(2) se wide mtitle("Coef.") scalars("rmse sigma") ///
    coef(_cons "Intercept" rmse "sigma") nonum noobs nostar var(15)
Chapter 12
12.1 Linear transformations
12.2 Centering and standardizing models with interactions
import delimited https://raw.githubusercontent.com/avehtari/ROS-Examples/master/KidIQ/data/kidiq.csv,  clear
* regress kid_score i.mom_hs mom_iq i.mom_hs#c.mom_iq // same as below
qui regress kid_score i.mom_hs##c.mom_iq
`gelman_output'
─────────────────────────────────────────
Coef.
─────────────────────────────────────────
0.mom_hs 0.0 (.)
1.mom_hs 51.3 (15.3)
mom_iq 1.0 (0.1)
0.mom_hs#c.mo~q 0.0 (.)
1.mom_hs#c.mo~q -0.5 (0.2)
Intercept -11.5 (13.8)
─────────────────────────────────────────
sigma 18.0
─────────────────────────────────────────
Standard errors in parentheses
Centering by subtracting the mean of the data
sum mom_hs,meanonly
gen c_mom_hs=mom_hs-r(mean)
sum mom_iq,meanonly
gen c_mom_iq=mom_iq-r(mean)
qui regress kid_score c.c_mom_hs##c.c_mom_iq
`gelman_output'
─────────────────────────────────────────
Coef.
─────────────────────────────────────────
c_mom_hs 2.8 (2.4)
c_mom_iq 0.6 (0.1)
c.c_mom_hs#c.~q -0.5 (0.2)
Intercept 87.6 (0.9)
─────────────────────────────────────────
sigma 18.0
─────────────────────────────────────────
Standard errors in parentheses
Using a conventional centering point
gen c2_mom_hs=mom_hs-0.5
gen c2_mom_iq=mom_iq-100
qui regress kid_score c.c2_mom_hs##c.c2_mom_iq
`gelman_output'
─────────────────────────────────────────
Coef.
─────────────────────────────────────────
c2_mom_hs 2.8 (2.4)
c2_mom_iq 0.7 (0.1)
c.c2_mom_hs#c~q -0.5 (0.2)
Intercept 86.8 (1.2)
─────────────────────────────────────────
sigma 18.0
─────────────────────────────────────────
Standard errors in parentheses
Standardiazing by subtracting the mean and dividing by 2 s.d.
qui sum mom_hs
gen z_mom_hs=(mom_hs-r(mean))/(2*r(sd))
qui sum mom_iq
gen z_mom_iq=(mom_iq-r(mean))/(2*r(sd))
qui regress kid_score c.z_mom_hs##c.z_mom_iq
`gelman_output'
─────────────────────────────────────────
Coef.
─────────────────────────────────────────
z_mom_hs 2.3 (2.0)
z_mom_iq 17.7 (1.8)
c.z_mom_hs#c.~q -11.9 (4.0)
Intercept 87.6 (0.9)
─────────────────────────────────────────
sigma 18.0
─────────────────────────────────────────
Standard errors in parentheses
12.3 Correlation and “regression to the mean”
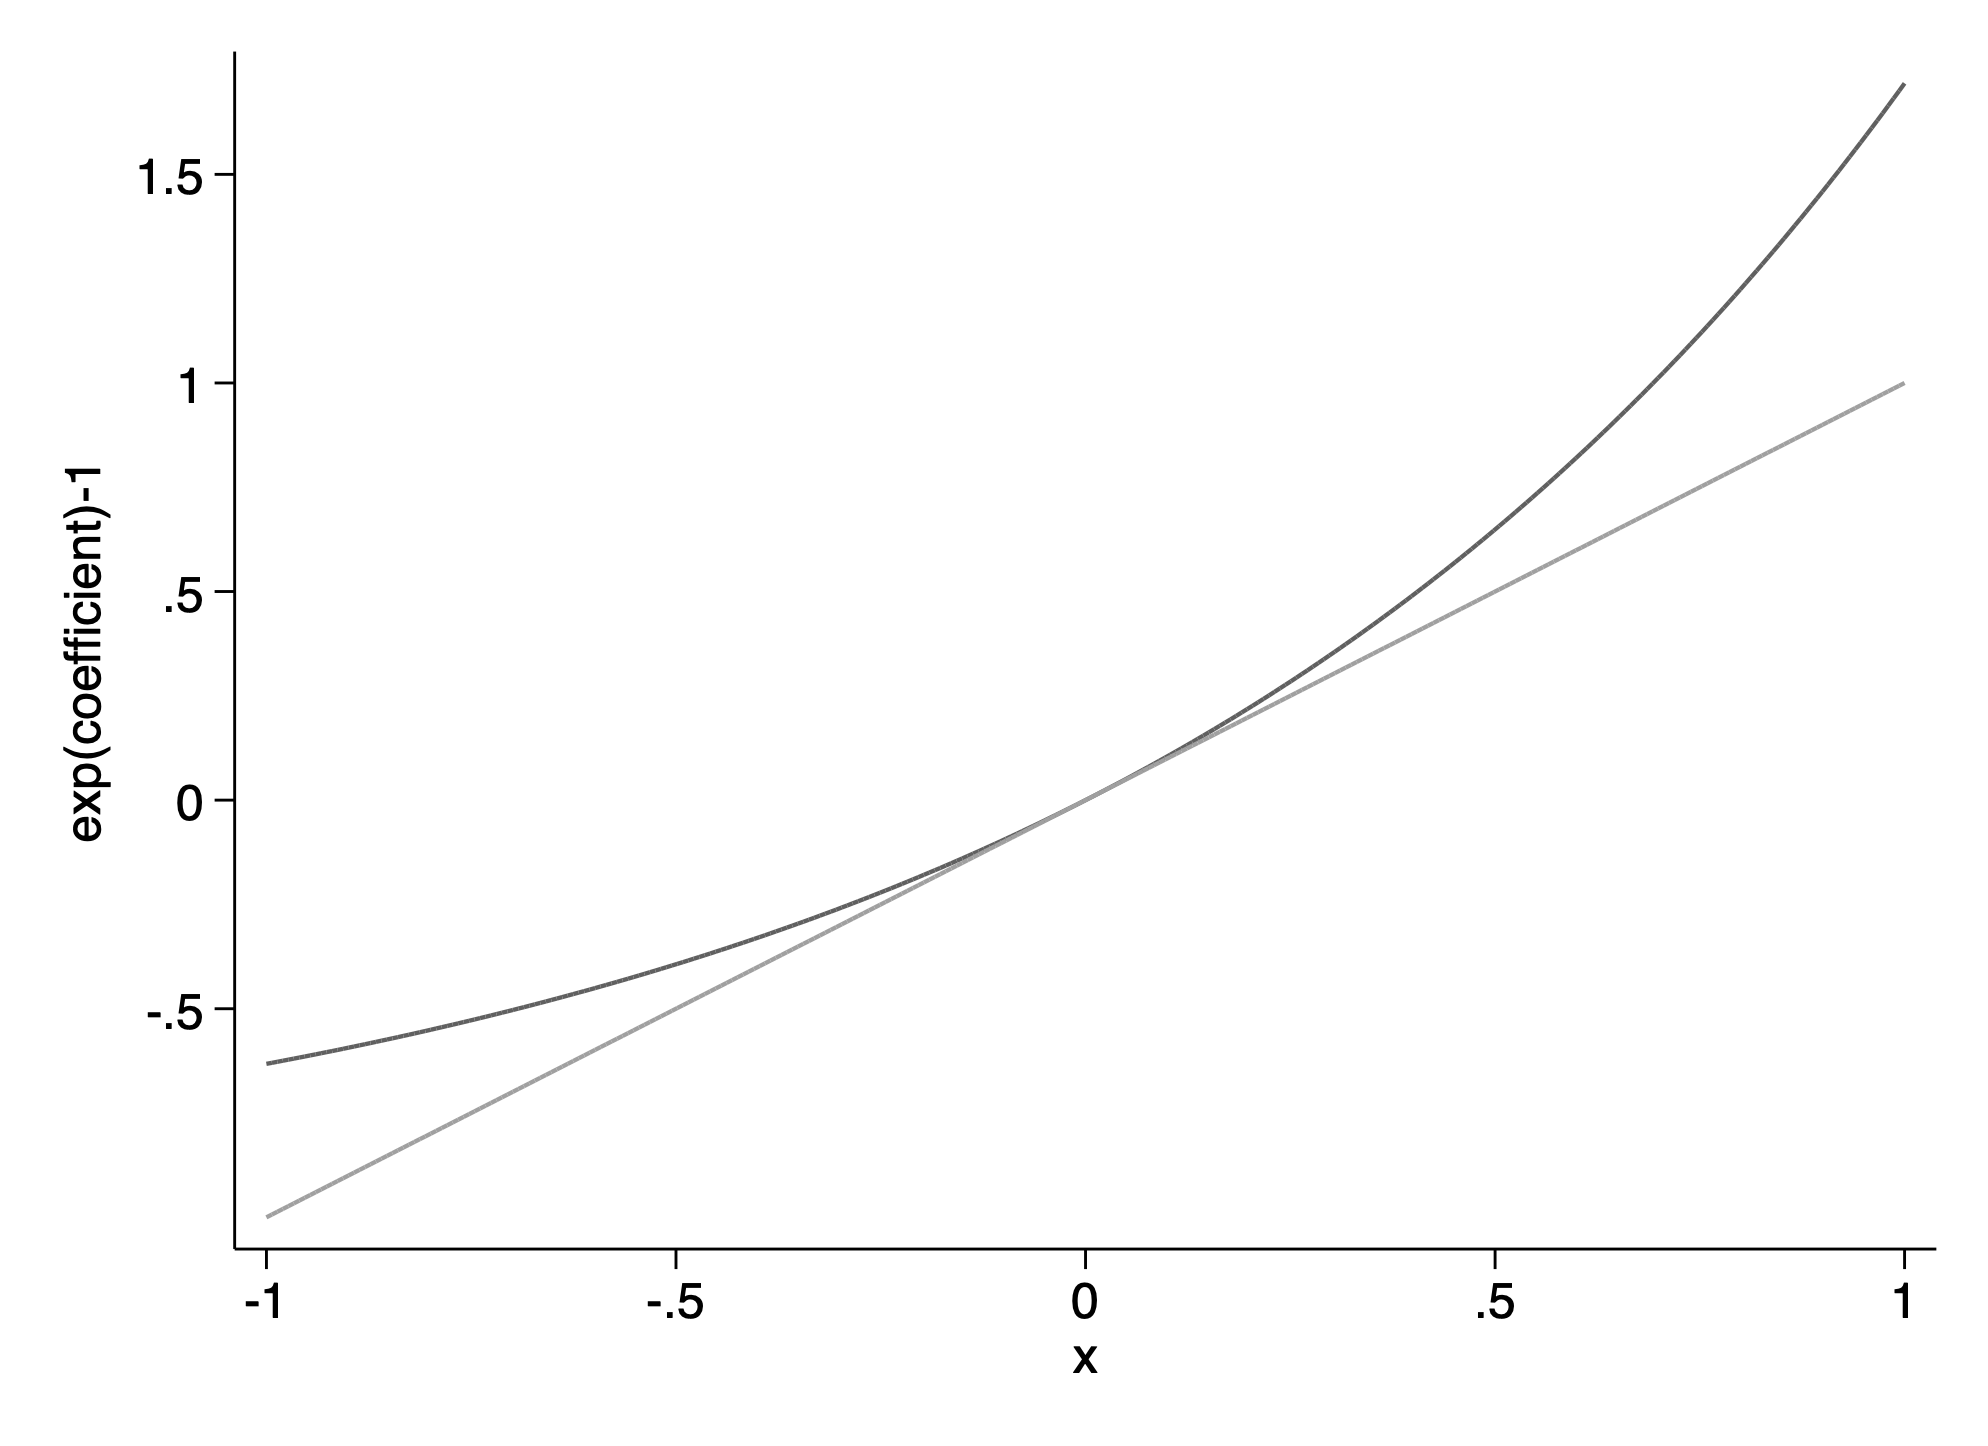
12.4 Logarithmic transformations
Earnings and height examples
import delimited https://raw.githubusercontent.com/avehtari/ROS-Examples/master/Earnings/data/earnings.csv,clear
gen log_earn=log(earn)
qui regress log_earn height
qui margins, expression(exp(predict(xb))*(exp((`e(rmse)'^2))/2))  ///
         at(height=(57(1)82))
marginsplot, title(Log regression plotted on natural scale) ytitle(earnings) ///
    recastci(rarea) plotop(m(i) legend(off) ) ciopt(color(black%20)) ///
    addplot(scatter earn height if earn<300000,ms(o)) name(fig_b,replace) scheme(sol)
twoway scatter log_earn height,ms(o) || lfitci log_earn height , ///
    ysc(log) name(fig_a, replace) title(Log regression plotted on log scale) ///
    legend(off) ytitle("log(earnings)") scheme(sol) ysize(3)
graph combine fig_a fig_b
. twoway function y=exp(x)-1 ,range(-1 1) || function y=x , range(-1 1) ///
> ylab(-.5(.5)1.5)  scheme(sol) legend(off) ytitle("exp(coefficient)-1")
(file /Users/thofer/Box/sites/umich(secure)/hhcr/raos_gelman/img/fig12_4_stata.png written in PNG format)
Predictive checking
qui regress earn height
cap drop earn_r*
forval i=1/20    {
    qui gen earn_r`i'=_b[_cons] + ///
        _b[height]*height + rnormal(0,`e(rmse)')
}
twoway kdensity earn || kdensity earn_r1,lc(gs14) lpatt(solid) ||  ///
    kdensity earn_r2,lc(gs14) lpatt(solid) || kdensity earn_r3,lc(gs14) lpatt(solid) || ///
    kdensity earn_r4,lc(gs14) lpatt(solid) || kdensity earn_r5,lc(gs14) lpatt(solid) || ///
    kdensity earn_r6,lc(gs14) lpatt(solid) || kdensity earn_r7,lc(gs14) lpatt(solid) || ///
    kdensity earn_r8,lc(gs14) lpatt(solid) || kdensity earn_r9,lc(gs14) lpatt(solid) || ///
    kdensity earn_r10,lc(gs14) lpatt(solid) || kdensity earn_r11,lc(gs14) lpatt(solid) || ///
    kdensity earn_r12,lc(gs14) lpatt(solid) || kdensity earn_r13,lc(gs14) lpatt(solid) || ///
    kdensity earn_r14,lc(gs14) lpatt(solid) || kdensity earn_r15,lc(gs14) lpatt(solid) || ///
    kdensity earn_r16,lc(gs14) lpatt(solid) || kdensity earn_r17,lc(gs14) lpatt(solid) || ///
    kdensity earn_r18,lc(gs14) lpatt(solid) || kdensity earn_r19,lc(gs14) lpatt(solid) || ///
    kdensity earn_r20,lc(gs14) lpatt(solid) , ysc(off) xtitle("") legend(off) ///
    xlab(0(100000)400000)   subtitle("earn",pos(11)) name(fig12_5a,replace) ///
    ysc(fextend) xsc(fextend)
qui regress log_earn height
cap drop log_earn_r*
set seed 29922
forval i=1/20 {
qui gen log_earn_r`i'=_b[_cons] + ///
_b[height]*height + rnormal(0,`e(rmse)')
}
twoway kdensity log_earn || kdensity log_earn_r1,lc(gs14) lpatt(solid) || ///
kdensity log_earn_r2,lc(gs14) lpatt(solid) || kdensity log_earn_r3,lc(gs14) lpatt(solid) || ///
kdensity log_earn_r4,lc(gs14) lpatt(solid) || kdensity log_earn_r5,lc(gs14) lpatt(solid) || ///
kdensity log_earn_r6,lc(gs14) lpatt(solid) || kdensity log_earn_r7,lc(gs14) lpatt(solid) || ///
kdensity log_earn_r8,lc(gs14) lpatt(solid) || kdensity log_earn_r9,lc(gs14) lpatt(solid) || ///
kdensity log_earn_r10,lc(gs14) lpatt(solid) || kdensity log_earn_r11,lc(gs14) lpatt(solid) || ///
kdensity log_earn_r12,lc(gs14) lpatt(solid) || kdensity log_earn_r13,lc(gs14) lpatt(solid) || ///
kdensity log_earn_r14,lc(gs14) lpatt(solid) || kdensity log_earn_r15,lc(gs14) lpatt(solid) || ///
kdensity log_earn_r16,lc(gs14) lpatt(solid) || kdensity log_earn_r17,lc(gs14) lpatt(solid) || ///
kdensity log_earn_r18,lc(gs14) lpatt(solid) || kdensity log_earn_r19,lc(gs14) lpatt(solid) || ///
kdensity log_earn_r20,lc(gs14) lpatt(solid) , ysc(off) xtitle("") legend(off) ///
xlab(6(2)12) ysc(fextend) xsc(fextend) subtitle("log(earn)",pos(11)) name(fig12_5b,replace)
graph combine fig12_5a fig12_5b
graph export img/fig12_5_stata.png,replace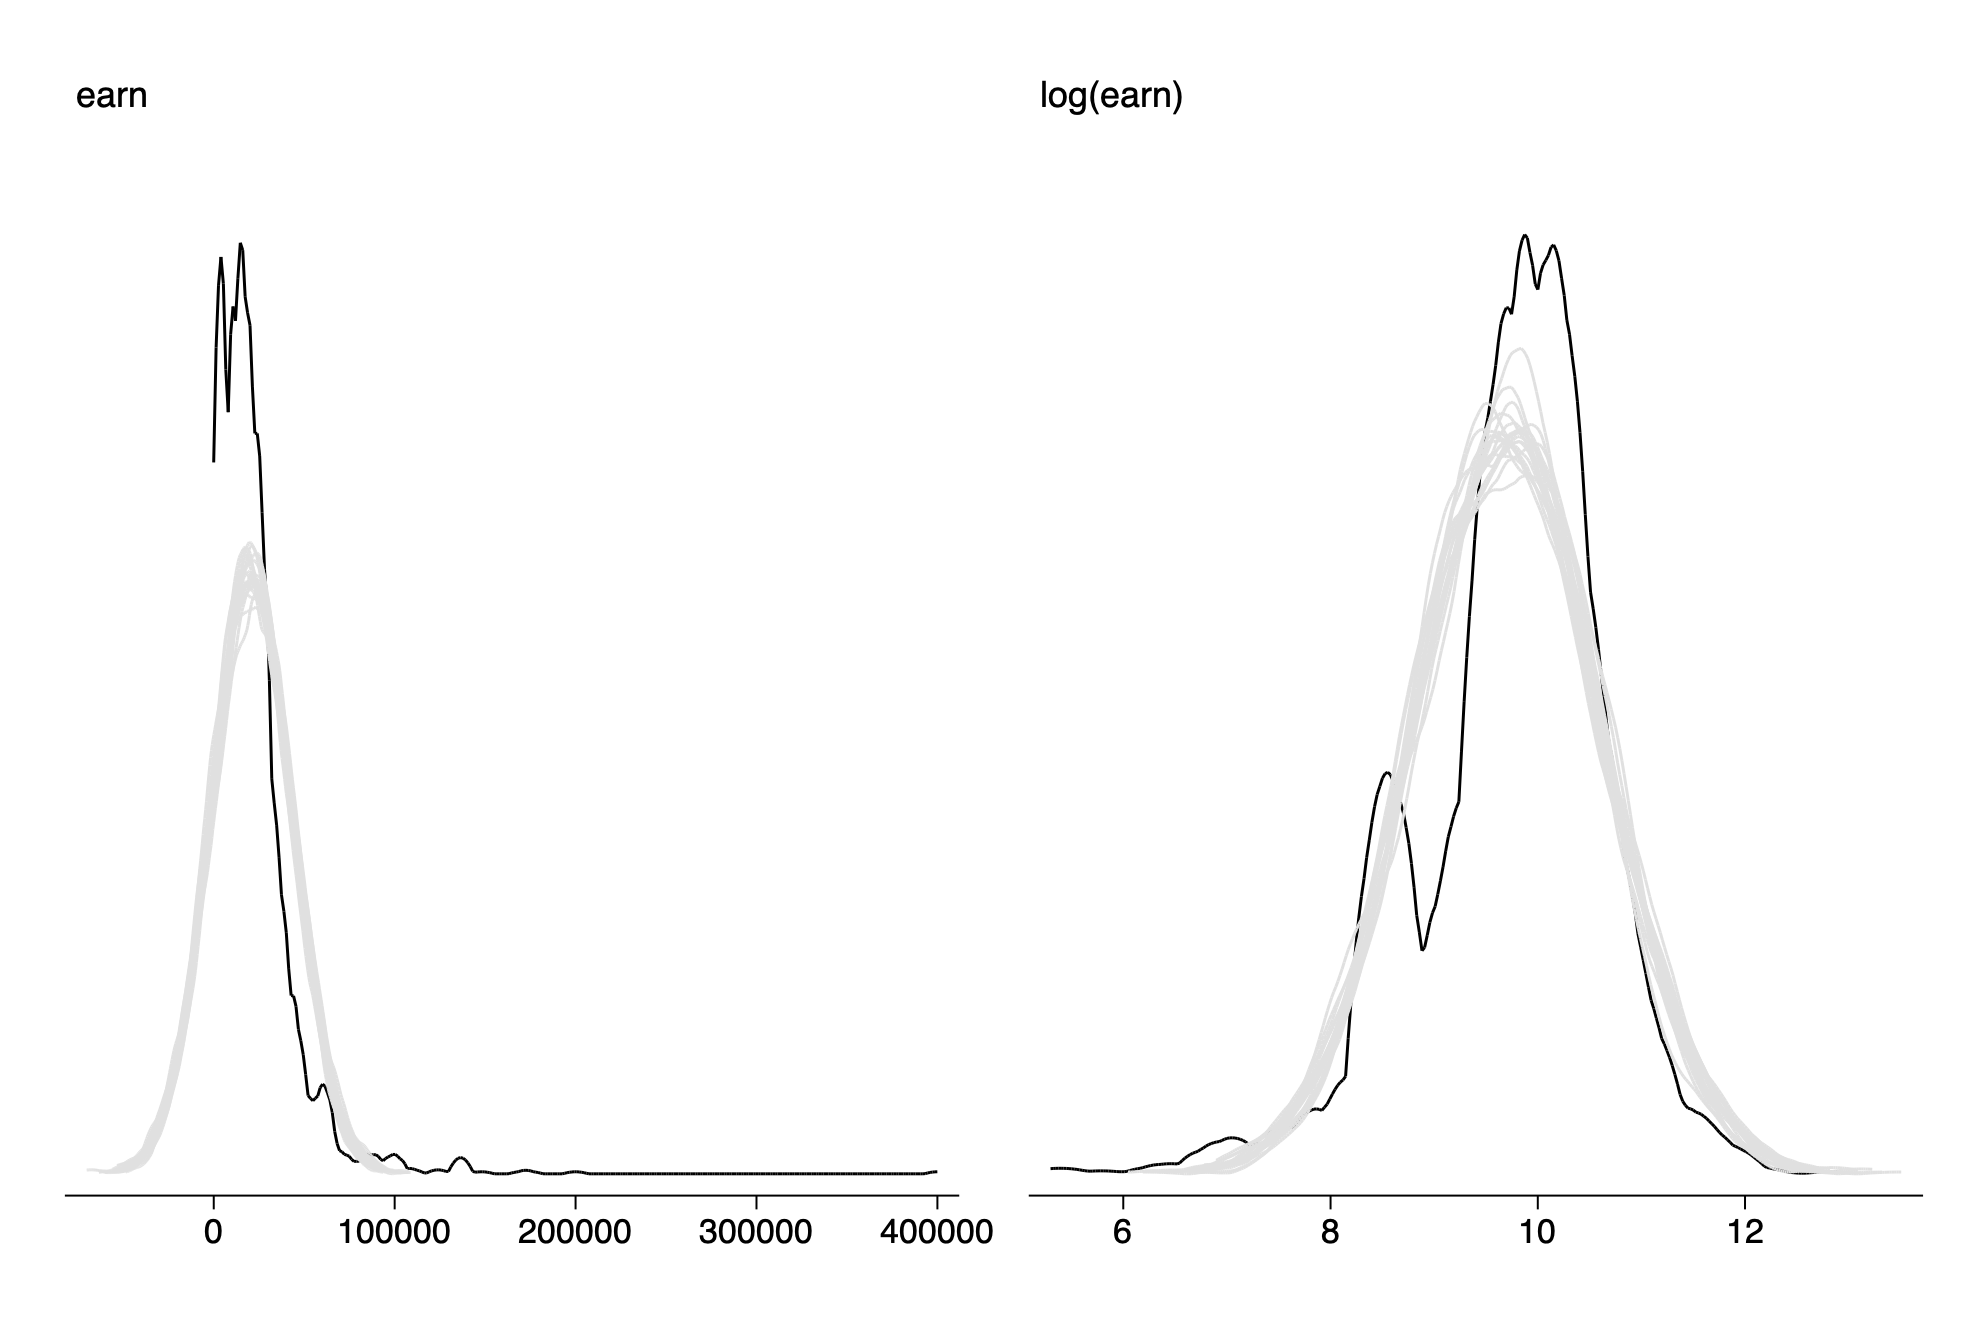
Buildig a regression model on the log scale
. qui regress log_earn height male

. `gelman_output2'

─────────────────────────────────────────
                       Coef.
─────────────────────────────────────────
height                  0.02       (0.01)
male                    0.37       (0.06)
Intercept               7.98       (0.51)
─────────────────────────────────────────
sigma                   0.87
─────────────────────────────────────────
Standard errors in parentheses

. di "Comparing a man and a woman of the same height"
Comparing a man and a woman of the same height

. di "the man's earnings are " exp(_b[male]) " times the woman's"
the man's earnings are 1.4499274 times the woman's
Including an interaction
qui regress log_earn c.height##i.male
`gelman_output2'
(Note that the book has a typo and the coefficient for male is -0.87 not -0.76, which is closer to the maximum likelihood estimate we get. This can be seen by going to the code and examples web page for the book.)
Linear transformation to make the coefficients more interpretable
qui sum height
qui gen z_height=(height-r(mean))/r(sd)
qui regress log_earn c.z_height##i.male
`gelman_output2'
Log-log model: transforming the input and output variables
. qui gen log_height=log(height)

. qui regress log_earn c.log_height i.male

. `gelman_output2'

─────────────────────────────────────────
                       Coef.
─────────────────────────────────────────
log_height              1.61       (0.52)
0.male                  0.00          (.)
1.male                  0.37       (0.06)
Intercept               2.81       (2.18)
─────────────────────────────────────────
sigma                   0.87
─────────────────────────────────────────
Standard errors in parentheses
12.5 Other transformations
Square root transformations
Idiosyncratic transformations
Using continuous rather than discrete predictors
Using discrete rather than continuous predictors
. qui import delimited https://raw.githubusercontent.com/avehtari/ROS-Examples/master/KidIQ/data/kidiq.csv,  clear

. qui reg kid_score i.mom_work

. `gelman_output'

─────────────────────────────────────────
                       Coef.
─────────────────────────────────────────
1.mom_work               0.0          (.)
2.mom_work               3.9        (3.1)
3.mom_work              11.5        (3.6)
4.mom_work               5.2        (2.7)
Intercept               82.0        (2.3)
─────────────────────────────────────────
sigma                   20.2
─────────────────────────────────────────
Standard errors in parentheses
12.6 Building and comparing regression models for prediction
Example predicting the yields of mesquite bushes
- The input file is problematic and requires a bit of munging to get it in.
qui import delimited  https://raw.githubusercontent.com/avehtari/ROS-Examples/master/Mesquite/data/mesquite.dat,   clear
drop in 1
split v1, generate(var) destring
drop v1
local i=1
foreach var of new obs group diam1 diam2 total_height canopy_height density weight {
    rename var`i++' `var'
}
. encode group,gen(group_cat)
. regress weight diam1 diam2 canopy_height total_height density i.group_cat
Source │ SS df MS Number of obs = 46
─────────────┼────────────────────────────────── F(6, 39) = 36.34
Model │ 15774397 6 2629066.16 Prob > F = 0.0000
Residual │ 2821249.7 39 72339.7359 R-squared = 0.8483
─────────────┼────────────────────────────────── Adj R-squared = 0.8249
Total │ 18595646.7 45 413236.593 Root MSE = 268.96
──────────────┬────────────────────────────────────────────────────────────────
weight │ Coef. Std. Err. t P>|t| [95% Conf. Interval]
──────────────┼────────────────────────────────────────────────────────────────
diam1 │ 189.669 112.7601 1.68 0.101 -38.40981 417.7478
diam2 │ 371.4621 124.3785 2.99 0.005 119.8829 623.0413
canopy_height │ 355.6653 209.843 1.69 0.098 -68.7822 780.1128
total_height │ -101.7325 185.5739 -0.55 0.587 -477.0912 273.6261
density │ 131.2542 34.35527 3.82 0.000 61.7641 200.7443
│
group_cat │
MCD │ 363.2951 100.1841 3.63 0.001 160.6537 565.9365
_cons │ -1091.888 176.4563 -6.19 0.000 -1448.804 -734.9715
──────────────┴────────────────────────────────────────────────────────────────
. `gelman_output'
─────────────────────────────────────────
Coef.
─────────────────────────────────────────
diam1 189.7 (112.8)
diam2 371.5 (124.4)
canopy_height 355.7 (209.8)
total_height -101.7 (185.6)
density 131.3 (34.4)
1.group_cat 0.0 (.)
2.group_cat 363.3 (100.2)
Intercept -1091.9 (176.5)
─────────────────────────────────────────
sigma 269.0
─────────────────────────────────────────
Standard errors in parentheses
. cv_regress
Leave-One-Out Cross-Validation Results
─────────────────────────┬───────────────
Method │ Value
─────────────────────────┼───────────────
Root Mean Squared Errors │ 422.6364
Log Mean Squared Errors │ 12.0930
Mean Absolute Errors │ 233.4804
Pseudo-R2 │ 0.56315
─────────────────────────┴───────────────
. cv_kfold, k(10)
k-fold Cross validation
Number of Folds : 10
Number of Repetions : 1
Avg Root Mean SE : 403.55251
. tabstat diam1-weight , stat(min p25 median p75 max iqr) col(s)
variable │ min p25 p50 p75 max iqr
─────────────┼────────────────────────────────────────────────────────────
diam1 │ .8 1.4 1.95 2.5 5.2 1.1
diam2 │ .4 1 1.525 1.9 4 .9
total_height │ .65 1.2 1.5 1.7 3 .5
canopy_hei~t │ .5 .85 1.1 1.3 2.5 .45
density │ 1 1 1 2 9 1
weight │ 60.2 217.5 361.85 693.5 4052 476
─────────────┴────────────────────────────────────────────────────────────
. foreach var of varlist weight diam1 diam2 canopy_height total_height density {
  2. gen log_`var'=log(`var')
  3. }

. qui regress log_weight log_diam1-log_density i.group_cat

. esttab,b(1) se wide mtitle("Coef.") scalars("rmse sigma") ///
> coef(_cons "Intercept" rmse "sigma") nonum noobs nostar var(15)

─────────────────────────────────────────
                       Coef.
─────────────────────────────────────────
log_diam1                0.4        (0.3)
log_diam2                1.2        (0.2)
log_canopy_he~t          0.4        (0.3)
log_total_hei~t          0.4        (0.3)
log_density              0.1        (0.1)
1.group_cat              0.0          (.)
2.group_cat              0.6        (0.1)
Intercept                4.8        (0.2)
─────────────────────────────────────────
sigma                    0.3
─────────────────────────────────────────
Standard errors in parentheses

. cv_regress


Leave-One-Out Cross-Validation Results
─────────────────────────┬───────────────
         Method          │    Value
─────────────────────────┼───────────────
Root Mean Squared Errors │       0.3584
Log Mean Squared Errors  │      -2.0525
Mean Absolute Errors     │       0.2673
Pseudo-R2                │      0.84304
─────────────────────────┴───────────────
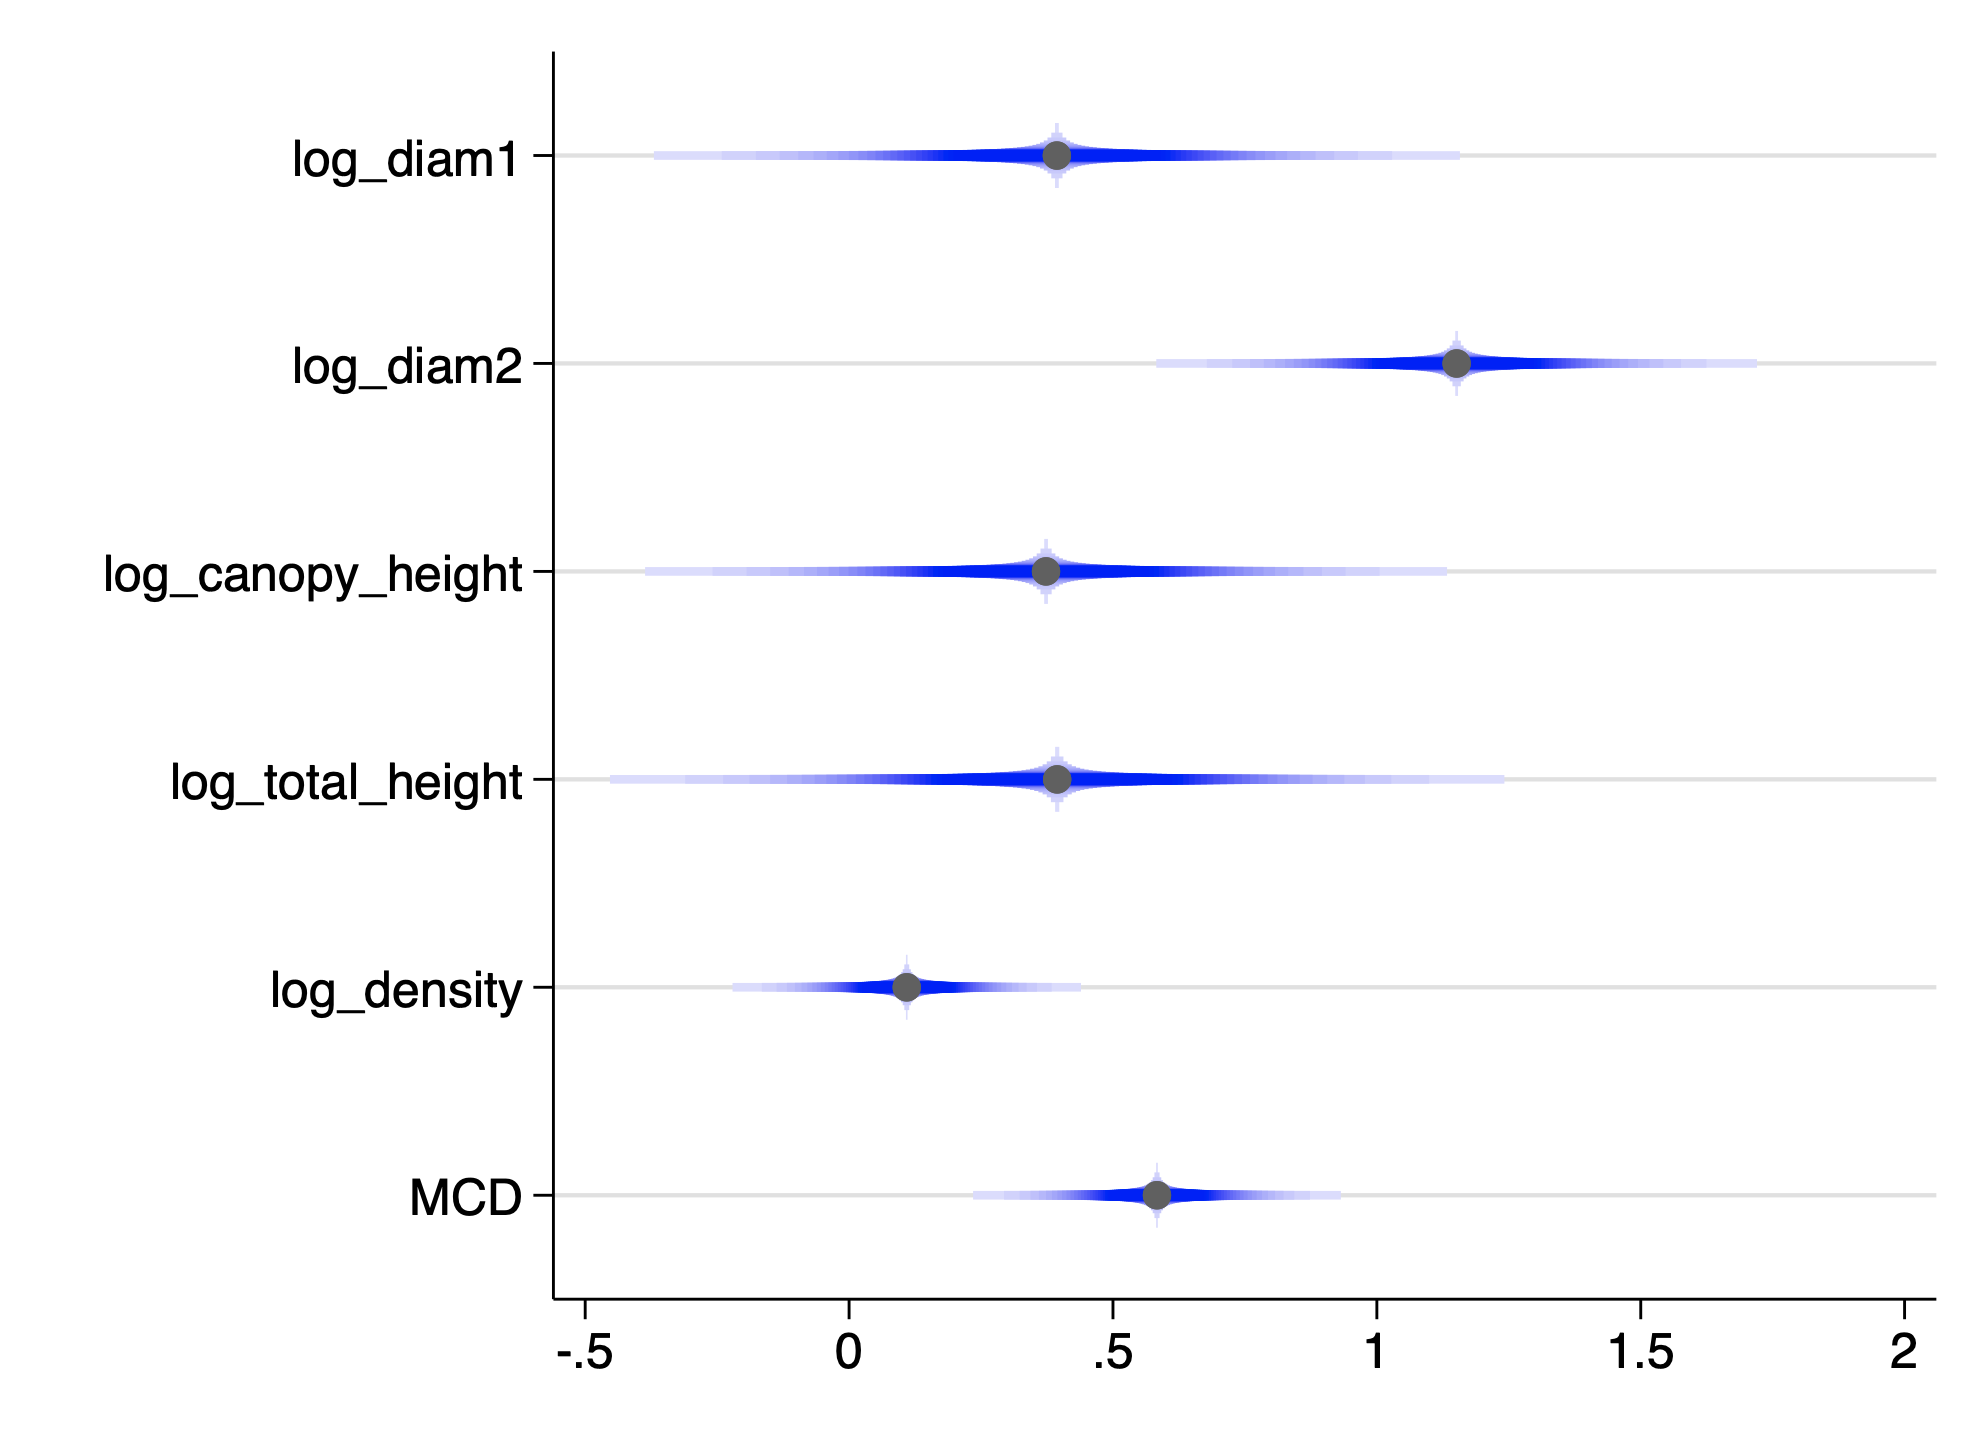
The predictive checks are kind of a pain to do for regression with multiple covariates (as opposed to bayesian regression) but the procedure is the same as those illustrated above.
. coefplot ,drop(_cons) cismooth(c(blue)) scheme(sol)

. qui graph export img/fig_12_9_stata.png,replace
The variance inflation factors are another way to look for collinearity
. estat vif

    Variable │       VIF       1/VIF
─────────────┼──────────────────────
   log_diam1 │      5.11    0.195646
   log_diam2 │      5.02    0.199053
log_canopy~t │      3.87    0.258695
log_total_~t │      4.62    0.216469
 log_density │      1.92    0.522029
 2.group_cat │      1.72    0.580131
─────────────┼──────────────────────
    Mean VIF │      3.71
The rest of the examples are just variants of ones showed above.